Candlestick Patterns for Binary Options: How to Read the Market and Enter Without Chaos

Promo code: TREND (+100% on your first deposit)
Candlestick patterns help you read price logic without chaotic entries, but in binary options a nice-looking shape on the chart is not enough. Context, level, confirmation, and sensible expiry matter just as much. Below, we will break down a practical foundation you can start learning from and then carefully test scenarios on demo and on Binarium — when registering for the first time, you can use the promo code TREND.
Important: this material is educational. It is not investment advice and not a promise of profit. Candlestick analysis is a way to read the market, not a “money button”.
Short answer: what candlestick analysis is in binary options
Candlestick analysis in binary options means reading price behavior through Japanese candlesticks and their combinations in order to find clearer entry points.
But in binary options, the pattern itself is not the only thing that matters. A workable setup looks like this:
- market context — trend or sideways market;
- level — support or resistance;
- candlestick pattern;
- confirmation;
- expiry.
The logic is not “see a candle — click the button,” but “see the pattern in the right place — wait for confirmation — choose a sensible expiry.”
Where a beginner should start: 3 patterns worth learning first
If you are just starting to explore candlestick patterns for binary options, do not try to learn 10-20 models at once. For the beginning, three are enough:
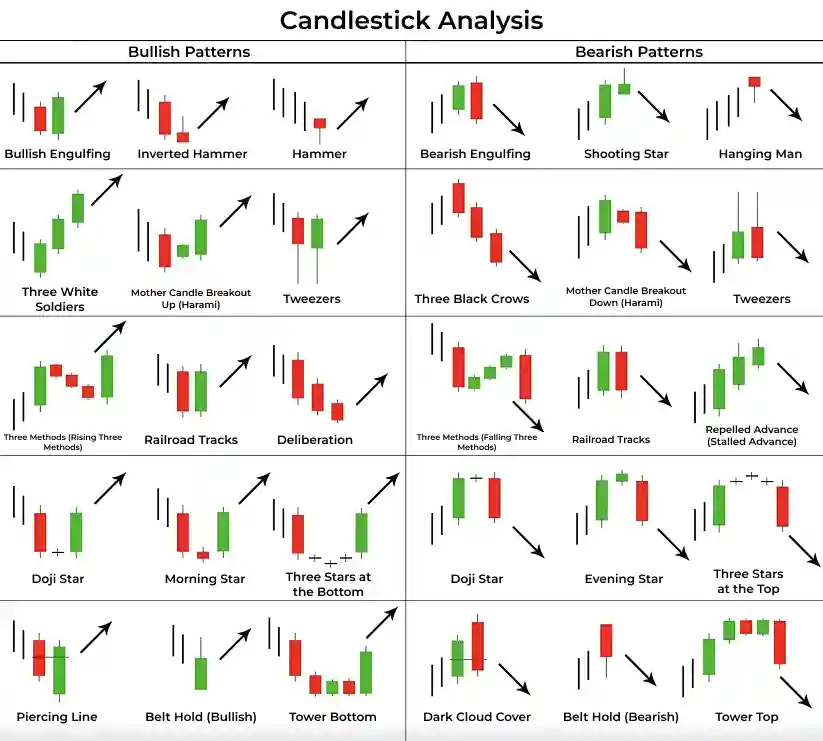
- Pin bar — often shows a bounce or a false breakout at a level.
- Engulfing — shows a shift in initiative between buyers and sellers.
- Doji — not a signal for instant entry, but a sign of pause and uncertainty.
That alone is enough to start seeing market logic instead of just memorizing names.
What a candle is and what matters in it for a trader
If you are studying candlestick analysis for binary options, first you need to understand the basics: what a single candle shows.
One candle is the price movement over a chosen period, meaning a specific timeframe. For example, on M5, one candle shows what happened to price over 5 minutes.
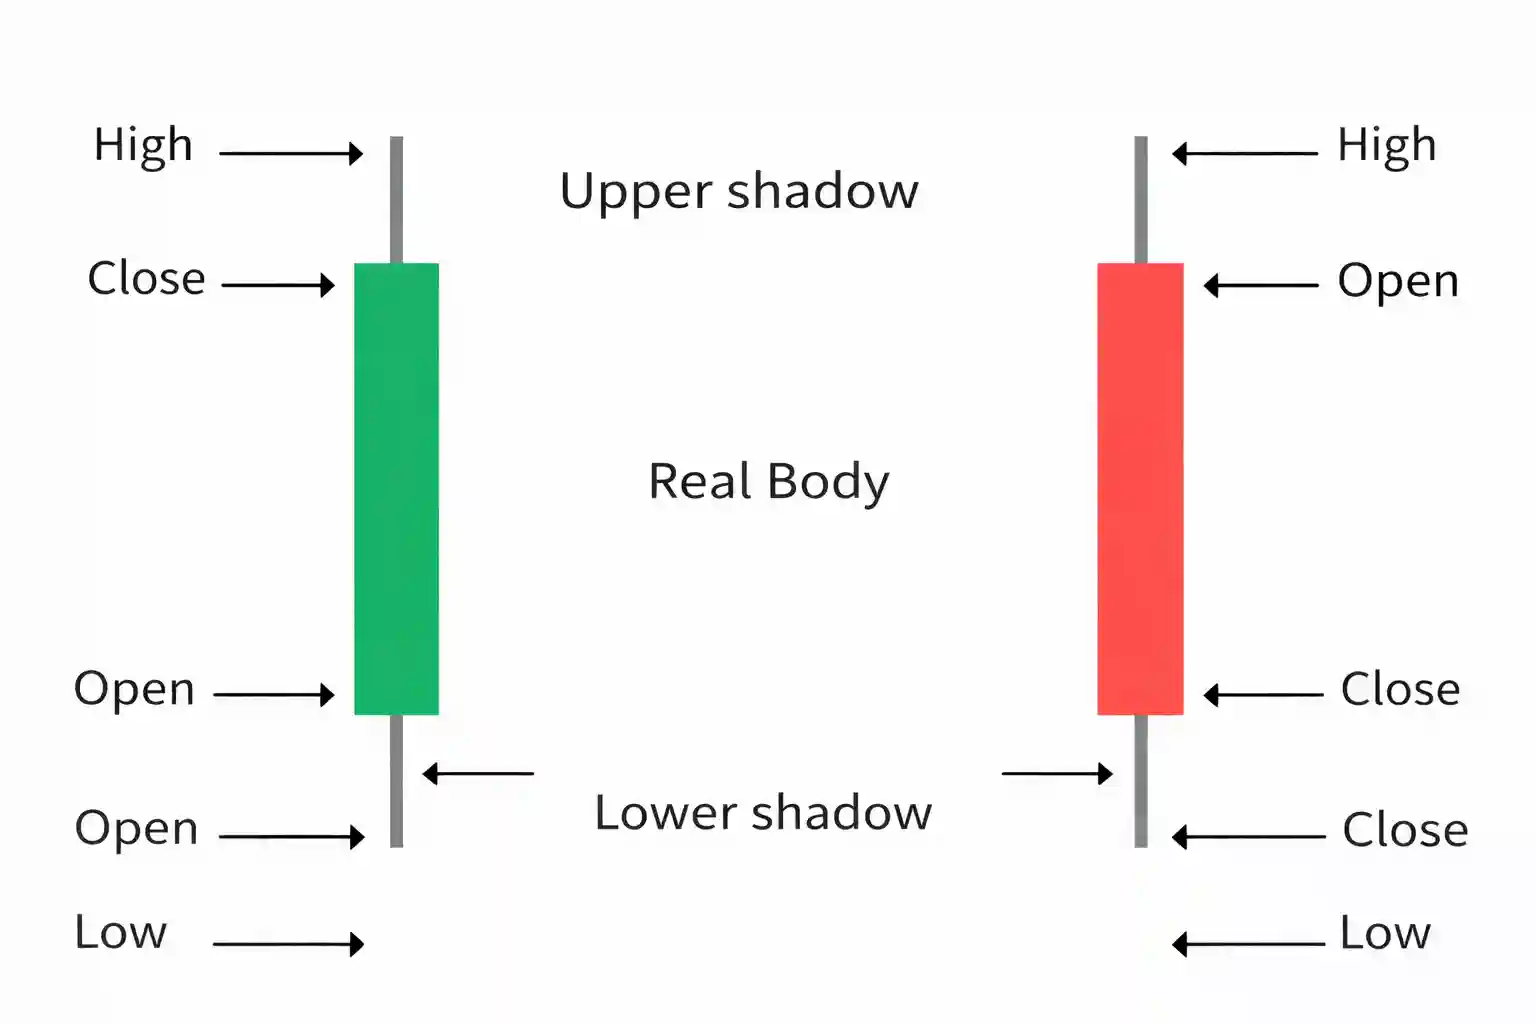
What is inside a candle
- Open — opening price.
- Close — closing price.
- High — the high.
- Low — the low.
- Candle body — the distance between open and close.
- Wicks — the areas from the body to the high and low.
Table: candle elements and how a beginner should read them
| Element | What it shows | How a beginner should interpret it | Common mistake |
|---|---|---|---|
| Candle body | The difference between the open and close | The larger the body, the stronger the immediate impulse | Treating any long candle as a ready-made entry signal |
| Upper wick | Rejection of higher prices | Can show seller pressure | Ignoring context: level and trend |
| Lower wick | Rejection of lower prices | Can show buyer pressure | Entering from a single wick without confirmation |
| Close | The final result of the period | The candle close is often more important than the beautiful shape during formation | Entering before the candle closes |
| High / Low | The extremes of the period | Help you understand the strength of the move and volatility | Not accounting for market noise |
What body size and wick length show
- A long body more often points to a strong move in the moment.
- A small body suggests the market is slowing down or hesitating.
- Long wicks can show rejection, but only if it happens in a meaningful place.
- A small body plus long wicks often means a zone of uncertainty.
Candlestick analysis in binary options: how it differs from regular technical analysis
In the regular market, a trader usually thinks about two things: where price may go and how far it can travel.
In binary options, you solve two tasks at once:
- direction — up or down;
- time — the trade expiry.
That is why even a good candlestick signal may fail to translate into a result if you entered too early, ignored confirmation, or chose an unsuitable expiry.
Where candlestick analysis in binary options works better and where it works worse
This is where real market logic begins, not just candle pictures.
Where candlestick analysis is usually read more clearly
- in a trend, when you are looking for entries in the direction of movement;
- after a pullback, not at the peak of an impulse;
- near a support or resistance level;
- when there is confirmation from the next candle or from price reaction.
Where signal quality is usually worse
- chaotic sideways movement — a noisy range;
- news spikes and sharp erratic moves;
- a very thin market where candles draw pretty shapes without follow-through;
- a pattern in the middle of the chart, without a level and without context.
In short: a pattern is strong not by itself, but in the right place.
Which candlestick patterns for binary options are worth studying first
1) Pin bar (bullish / bearish)
A pin bar is a candle with a small body and a long wick. It often shows that price was pushed, but the move could not be sustained.
Where to look for it:
- at a support or resistance level;
- after a pullback in trend;
- after a false breakout of a level.
When the signal is weak:
- in the middle of noisy price action;
- without a level;
- if the candle is too small and gets lost among neighboring candles.
2) Bullish and bearish engulfing
Engulfing is a two-candle pattern where the second candle covers the body of the previous one. This often shows a shift in initiative.
- Bullish engulfing — growing buyer strength.
- Bearish engulfing — growing seller strength.
Where the pattern is stronger:
- after a pullback in trend;
- at a level;
- with confirmation from the next candle.
A typical mistake is seeing engulfing anywhere on the chart and entering without a filter.
3) Doji (an uncertainty candle)
In a doji, the open and close are close to each other. It is not a signal to click the button, but a sign that the market has not decided in the moment.
A doji is useful as:
- a warning of a pause;
- part of a reversal combination;
- a reason to wait for the next candle.
Important: a doji by itself is not an entry.
4) Hammer / hanging man
The shape is similar, but the meaning depends on where it appears on the chart.
- Hammer after a decline may show an attempt to reverse upward.
- Hanging man after a rise may show weakness from buyers.
A simple rule: first look at the location on the chart, then at the pattern name.
5) Morning / evening star (optional)
These are multi-candle reversal patterns. You can add them later, once you can confidently read pin bars and engulfing patterns.
For a beginner, it matters more to learn to see:
- where the market is accelerating;
- where it is slowing down;
- where it is rejecting a level.
Table: pattern → where to look → what confirms it → when to skip
| Pattern | Signal type | Best context | What confirms it | When to skip |
|---|---|---|---|---|
| Pin bar | bounce / reversal | level, pullback in trend | candle close and the reaction of the next candle | middle of noise, no level |
| Engulfing | strengthening / reversal | level, end of a pullback | strong next candle, market structure | weak engulfing in a sideways market |
| Doji | uncertainty | after an impulse, at a level | breakout from the zone or the next candle | entering off a single doji without confirmation |
| Hammer | possible upward reversal | after a decline at support | close higher, buyer reaction | chaos without a level |
| Hanging man | possible weakening of the rise | after a rise at resistance | downside confirmation | strong impulse without confirmation |
How to use candlestick analysis in binary options: a step-by-step framework
Below is a basic algorithm that helps turn binary options candlestick analysis from a set of pictures into a clear system.
Step 1. Define the context: trend or sideways market
First answer the question: is the market moving with direction, or just drifting around?
- In a trend, patterns in the direction of the move are usually read better.
- In a sideways market, there are more false moves and pretty but empty signals.
For a beginner, it is easier to start with trend-following patterns rather than constantly trying to catch reversals.
Step 2. Mark a level (support/resistance)
A candlestick pattern without a level is often just a shape. A candlestick pattern at a level is already a market story.
What to do:
- mark zones where price has already reacted;
- watch for a repeat approach to that zone;
- do not force the level to fit the pattern.
Step 3. Wait for the candle to close and for confirmation
One of the most expensive mistakes is entering while the candle is still forming.
Why it is a problem:
- a pin bar can close as a regular candle;
- an engulfing pattern can break before the close;
- a doji can disappear.
At minimum:
- wait for the pattern candle to close;
- assess the next candle — does it confirm the signal or break it.
Step 4. Match the expiry to the timeframe
In binary options this is critical. Expiry should give the market enough time to play out your scenario, but it should not be random.
Table: timeframe and a rough expiry guideline (as a starting hypothesis)
Important: this is a starting hypothesis for demo testing, not a ready-made setting you can simply plug in and profit from. The same pattern on different assets and at different market times may require a different expiry.
| Timeframe | What you are analyzing | Expiry guideline |
|---|---|---|
| M1 | Fast micro-movements, lots of noise | 1-3 candles |
| M5 | More readable local moves | 1-3 candles, sometimes 4 |
| M15 | A calmer structure | 1-3 candles depending on the scenario |
It is more convenient to think in candles rather than minutes. That makes it easier to compare different timeframes.
If you decide to test these scenarios on a platform, do it only after demo validation and with a clear per-trade risk. To get started on Binarium, you can activate the promo code TREND, but a bonus is not a substitute for discipline and a trading journal.
Candlestick patterns in binary options: entry examples (scenarios)
Below are not signals, but educational scenarios to help you understand the logic.
Example 1. Trend entry after a pullback + pin bar
Situation:
- the market is moving up;
- price pulls back to a support zone;
- a bullish pin bar forms with a long lower wick;
- the next candle confirms the bounce.
Logic:
- you are trading with the trend;
- there is a level;
- there is a pattern;
- there is confirmation.
Example 2. Engulfing at a level
Situation:
- price approaches a level;
- an engulfing pattern appears;
- the next candle does not invalidate the signal.
What to watch:
- how much stronger the second candle is than the first;
- whether the pattern has room on the chart;
- whether there is market chaos nearby.
Example 3. A false signal
Situation:
- you can see something that looks like a pin bar;
- but it is located in the middle of a noisy range;
- there is no nearby level;
- the candles before it are chaotic, with wicks in both directions.
Common beginner mistakes in binary options candlestick analysis
This is where losses most often begin, even if a person already knows the pattern names.
1) Entering from a single pattern without context
A pin bar or engulfing pattern does not create an edge on its own if it appears inside noise and without a level.
2) Trading against the trend “because the shape looks nice”
A beginner sees a hammer or engulfing and tries to catch a reversal inside a strong move. Often, the market simply continues the trend.
3) Entering before the candle closes
A frequent and expensive mistake. The candle can change completely by the close.
4) Expiry that is too short
Even a decent scenario does not have enough time to play out, and the trade closes against you.
5) Trading in chaotic sideways markets and on news noise
In a sideways market and during sharp news-driven moves, candles often look technically beautiful but produce many false signals. The beginner sees the shape, but misses the main thing — the market is hard to read in that moment.
6) Overtrading after a couple of good entries
After 2-3 wins, random trades often start to appear because of overconfidence. At that point, it is no longer analysis, but emotion.
7) No trade journal
Without a journal, you do not see where the result is actually breaking down:
- in the pattern;
- in the context;
- in the expiry;
- in discipline.
If you feel like you enter just to avoid missing the move, it is useful to read about FOMO in trading — it genuinely affects entry quality.
Checklist: how to use candlestick analysis for binary options more safely
Before every trade, quickly run through these points:
- I understand the context: trend or sideways market;
- there is a level or zone, not just a pattern in empty space;
- the pattern candle has closed and is not still forming;
- there is confirmation — the next candle or price reaction;
- the expiry is chosen to fit the timeframe and scenario;
- the risk on the trade is clear;
- I am not trading emotionally and not trying to win losses back;
- this is not news chaos where the market is being ripped both ways.
Save this checklist. In practice, it usually brings more value than ten more “secret” patterns.
Mini trade journal template for candlestick patterns
To understand whether candlestick analysis works for you in binary options, record at least this:
- date and time;
- asset;
- timeframe;
- pattern;
- context — trend or sideways market, level;
- confirmation;
- expiry — in candles;
- result;
- mistake or conclusion.
After 20-30 trades, you will get more value than from endlessly reading articles without practice.
Do you need indicators if you already have candlestick patterns
The debate of “candles or indicators” usually leads nowhere. A reasonable approach looks like this:
- candles show price behavior;
- levels and trend provide context;
- indicators can be used as a filter if you understand why you need them.
The problem is usually not the indicators themselves, but the attempt to pile on 5-7 of them and wait for perfect alignment. For the start, minimalism works better.
If you are just building your foundation, first read the material on what trading is and how a beginner should start, then check the charts and indicators section.
Which timeframe is better for a beginner to study candlestick patterns on
For learning, it is usually easier to start where there is less market noise and candles are calmer to read.
A practical path:
- choose 1-2 timeframes;
- do not jump between M1, M5, and M15 every minute;
- test the same set of patterns under the same conditions.
Otherwise, you will not understand what exactly is not working: the pattern, the context, the expiry, or discipline. If you want to go deeper into short-move trading, check the material on intraday trading in binary options.
FAQ on the topic “binary options candlestick analysis”
Does candlestick analysis work in binary options?
Yes, as a way to read price and spot repeating market situations, it does. But a pattern alone does not produce stable results without context, confirmation, and sensible expiry.
Which candlestick patterns for binary options should beginners learn first?
For a start, 2-4 patterns are enough: pin bar, engulfing, doji, and one reversal pattern such as a hammer or hanging man. Seeing them in the right place on the chart matters more than knowing many names.
Can you trade using only candlesticks?
You can, but beginners are usually helped by filters such as trend, levels, market timing, and an understanding of volatility. A common mistake is entering based only on the picture while ignoring context.
Which pattern is the most accurate?
There is no single most accurate pattern. The same pattern can be strong at a level in the direction of the trend and weak in a chaotic sideways market.
How do you choose expiry for a candlestick pattern?
It is more practical to choose expiry based on the timeframe and the expected move length in candles rather than by guesswork. The best approach is demo testing and a trade journal.
Why was the pattern there, but price still moved against it?
Most often the reason is one of the following: poor context, no confirmation, entering before the candle close, incorrect expiry, or news noise.
Do you need a demo account to study candlestick patterns?
Yes. It is the safest way to practice pattern recognition, context, and expiry without the pressure of real money.
Ready to apply this knowledge in practice?
Fund your Binarium account and use the promo code TREND to get a +100% bonus and test the strategy.