Entry Points in Binary Options: 6-Step Algorithm and 3 Working Setups

Promo code: TREND (+100% on your first deposit)
Some traders enter based on a feeling and lose money. Others wait for the perfect moment that never comes. Entry points in binary options are where most beginners stumble. In this article, you will get a clear 6-step algorithm, three specific setups with conditions, and a checklist you can use to review every trade.
Important: this material is educational. Test all ideas and setups on a demo account first. This is not investment advice and not a promise of profit. Risk warning.
What is an entry point in binary options
An entry point in binary options is the moment when the conditions on the chart line up and you can open a trade. It is not a random click on the Call or Put button, but a deliberate decision based on analysis.
In short: to find an entry point, you need to go through 6 steps — define the market phase, mark a level, wait for a signal, check confirmation, choose expiration, and make sure the risk is acceptable. Below you will find a breakdown of each step, three specific setups, and a checklist you can use to review any trade.
Why you cannot just guess an entry point
The query “how to guess an entry point in binary options” is one of the most common among beginners. And the problem is obvious right away: if you are guessing, you are not trading — you are gambling.
The math is simple. In binary options, you risk 100% of your stake to make roughly 70–80% profit. That means even with a 50% win rate, you still lose money overall. Suppose your stake is $10. You win 5 out of 10 trades: +$35 profit, −$50 loss. Total: −$15.
This is called negative expectancy. To break even, your win rate has to be around 55–60%. To make money, it needs to be even higher.
That is why entry quality matters more in binary options than in forex or the stock market. Every trade is all or nothing, and there is no way to move a stop-loss or wait for a pullback. Either you found a good entry point, or you handed money to the broker. So from here on, it is not about guessing — it is about a step-by-step algorithm.
Step-by-step algorithm for finding an entry point
Below is a six-step algorithm you can use to review any entry. It does not matter which asset or timeframe you trade — entry points are found using the same logic: first look at the market as a whole, then look for a specific signal, then confirm it, and only then enter. Never the other way around.
Step 1 — Define the market phase
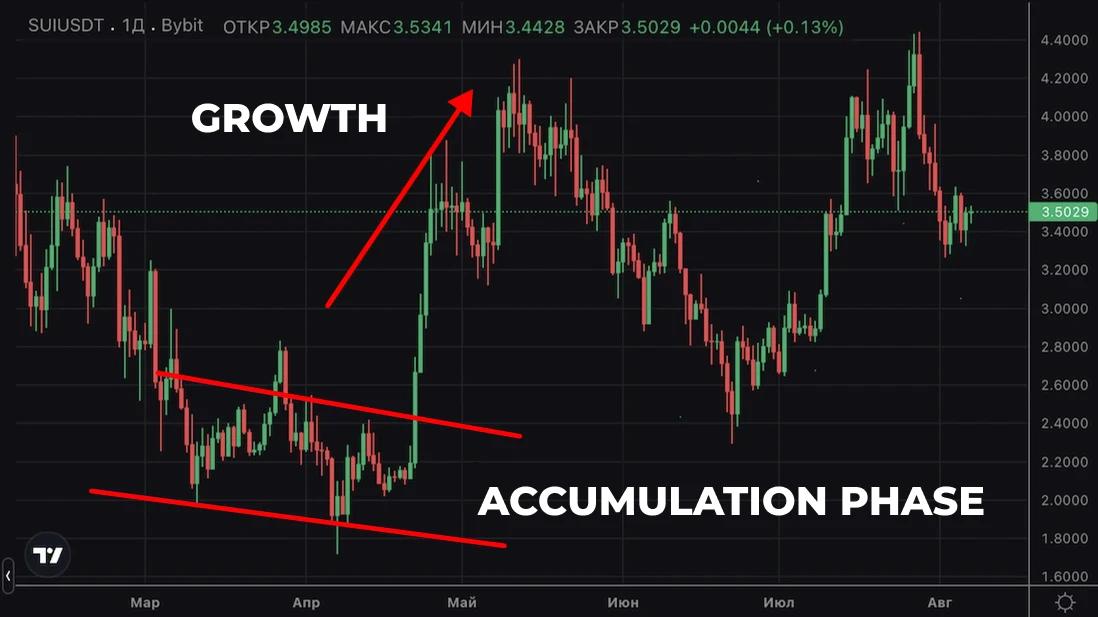
Before you look for entry signals, you need to understand what is happening on the chart right now. The market can be in three states:
Trend — price moves in one direction: up or down. You can see a sequence of highs and lows. In a trend, you look for entries in the direction of the move, on pullbacks.
Flat / range — price moves back and forth inside a horizontal corridor. There is no clear direction. In a range, you look for entries from the boundaries: from support upward, from resistance downward.
Chaos — sharp moves with no clear logic. This usually happens during news releases or when liquidity is low. Do not trade in chaos. No setup will help if the market is moving randomly.
How to identify the phase quickly: open the chart and look at a moving average (MA). If price is above the MA and the MA slopes upward, it is likely a trend. If price jumps around the MA and the MA itself is almost flat, it is more likely a range.
If step-by-step market analysis still feels unclear, check out the article on technical analysis for binary options — everything is explained there in detail.
Step 2 — Mark your levels
A level is a zone on the chart where price has reversed before. Support is below, resistance is above. At this step, you need to find 2–3 strong zones where price bounced clearly. Not 15 lines — just 2–3 key ones.
Why this matters: a level shows where to look for an entry. Without it, you are looking for a signal in empty space. How to draw levels, and how to trade bounces and breakouts, is covered in more detail below in the section on level-based entries.
Step 3 — Wait for a signal
A signal is a specific event on the chart that says: “this might be a good moment.” A signal can be a candlestick pattern at a level (pin bar, engulfing), an indicator reading (RSI in oversold territory, moving-average crossover), or a price reaction to a level (touch and bounce, breakout and hold).
The key rule: only look for a signal inside the zone you identified in step 2. A pin bar in the middle of the chart is weak. A pin bar right at support is a different story.
Step 4 — Confirm the signal
One argument is a weak reason to enter. Confirmation is your second argument in favor of the trade.
Examples: a pin bar at a level + RSI below 30 — two arguments. A bounce from support + an uptrend on the higher timeframe — also two. A moving-average crossover + MACD confirming direction — two.
If you only have a pattern but the indicator is silent, that is a reason to wait, not a reason to enter. Two arguments are enough. You do not need to wait for ten, otherwise you simply will not trade at all.
Step 5 — Choose expiration
Expiration is the time after which the trade closes. This is where beginners often go wrong: they use the familiar “60 seconds” no matter what timeframe they are trading.
A simple rule: expiration = 3–5 candles of your working timeframe. Found a signal on M5 → expiration 15–25 minutes. On M15 → 45–75 minutes. The full table is below in the section “Expiration and timeframe.”
Step 6 — Check risk and enter
Before you press the button, ask yourself three questions:
Is the stake size reasonable? The standard rule is no more than 1–3% of your deposit per trade. If your deposit is $100, your stake should be $1–3. Not $20 and not $50.
Is an important news release about to come out? Check the economic calendar. It is better not to enter 30 minutes before and 30 minutes after a major release — the market can behave unpredictably.
Are you trading on emotion? If you just lost three trades in a row and want to win it back, close the terminal. An emotional entry is not a trade — it is account damage.
If all three answers look fine — enter. If you doubt even one of them — skip the trade.
How to calculate stake size and when to stop is covered in detail in the article on money management in binary options.
Methods for finding an entry point: from simple to advanced
The algorithm is the framework. Now let us fill it with concrete tools. In essence, the whole question of how to find entry points in binary options comes down to the four methods below. Each one can be used separately, but on its own, each gives a weak signal. The real strength comes from combining them.
Entry points based on support and resistance levels
This is the most basic and at the same time one of the most reliable methods. There are two ways to use it:
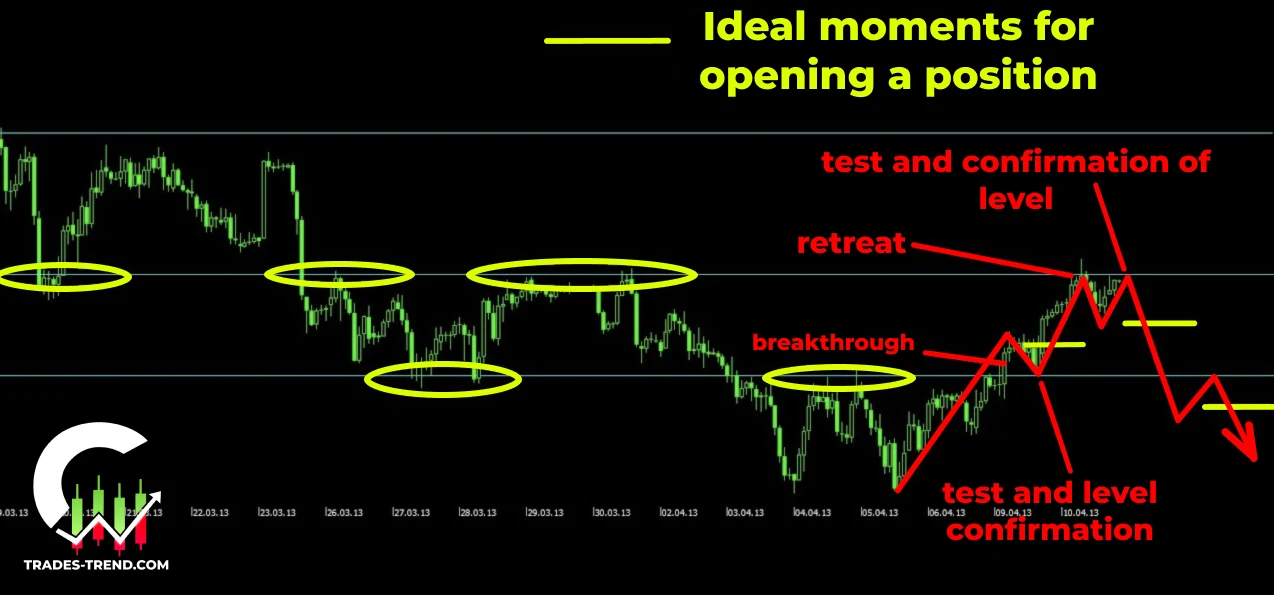
Bounce from a level. Price reaches a support or resistance zone and reverses. If price touches support and bounces up — Call entry. If it touches resistance and moves down — Put entry. For beginners, this is the clearest and safest option.
Breakout of a level. Price moves through a level and holds beyond it (the candle closes above resistance or below support). If support is broken downward — Put entry. If resistance is broken upward — Call entry. But breakouts are tricky: false breakouts happen often, when price pierces a level and then instantly returns. That is why for breakouts you must wait for the candle to close beyond the level.
A price channel is a special case of level-based trading. Draw a line through several lows (support) and another through the highs (resistance) — that gives you a channel. Price spends most of its time inside it. Enter from the boundaries: near the lower one — Call, near the upper one — Put.
How to draw levels in practice: open the chart and zoom out so you can see the move over the last 1–2 days. Find 2–3 points where price bounced clearly. Draw a horizontal line through them. A level is not a single-pixel price — it is a zone several points wide. That is why experienced traders draw a rectangle instead of a single line.
Entry points based on candlestick patterns
Candlestick patterns are the second most popular method for finding an entry. To get started, it is enough to know three models:
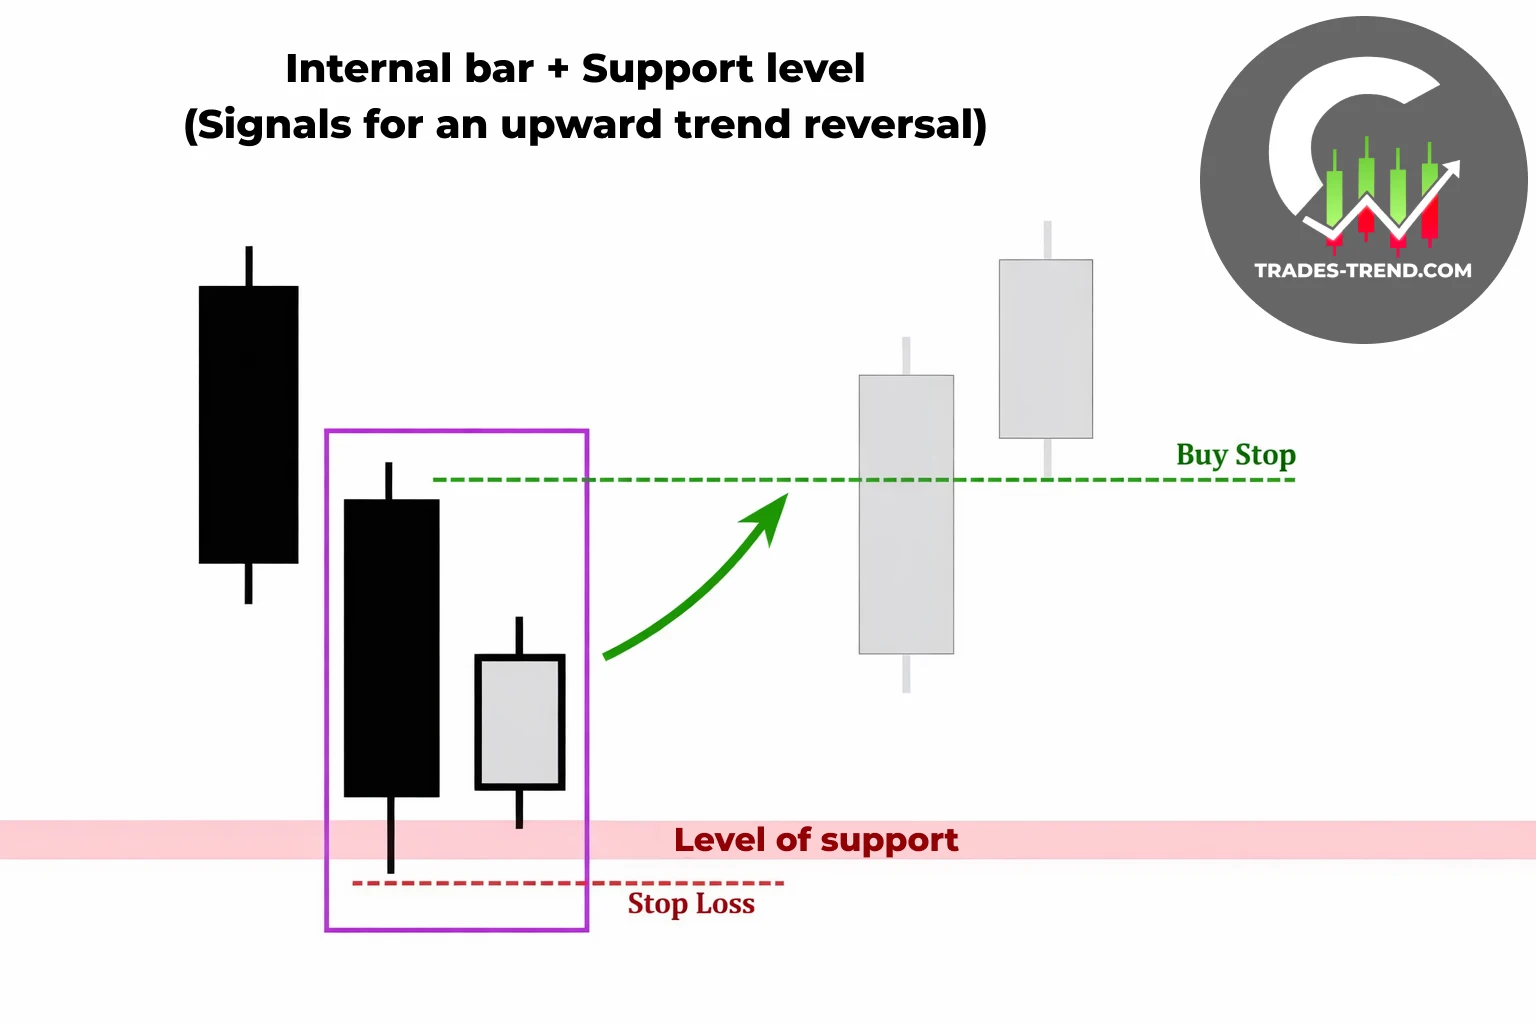
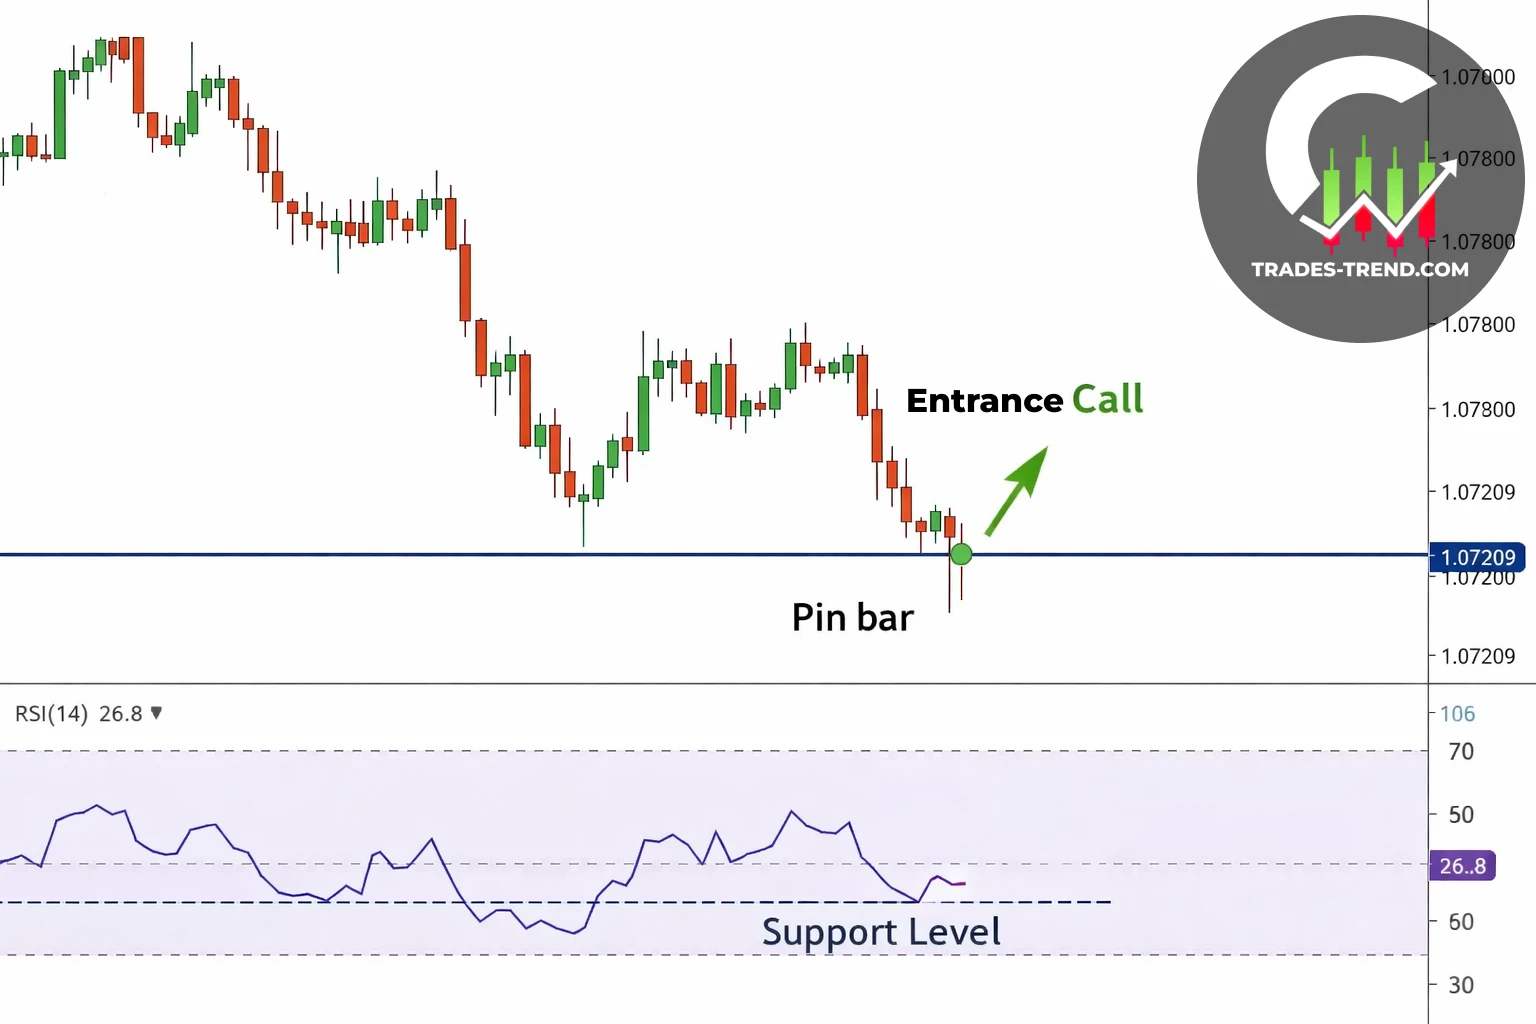
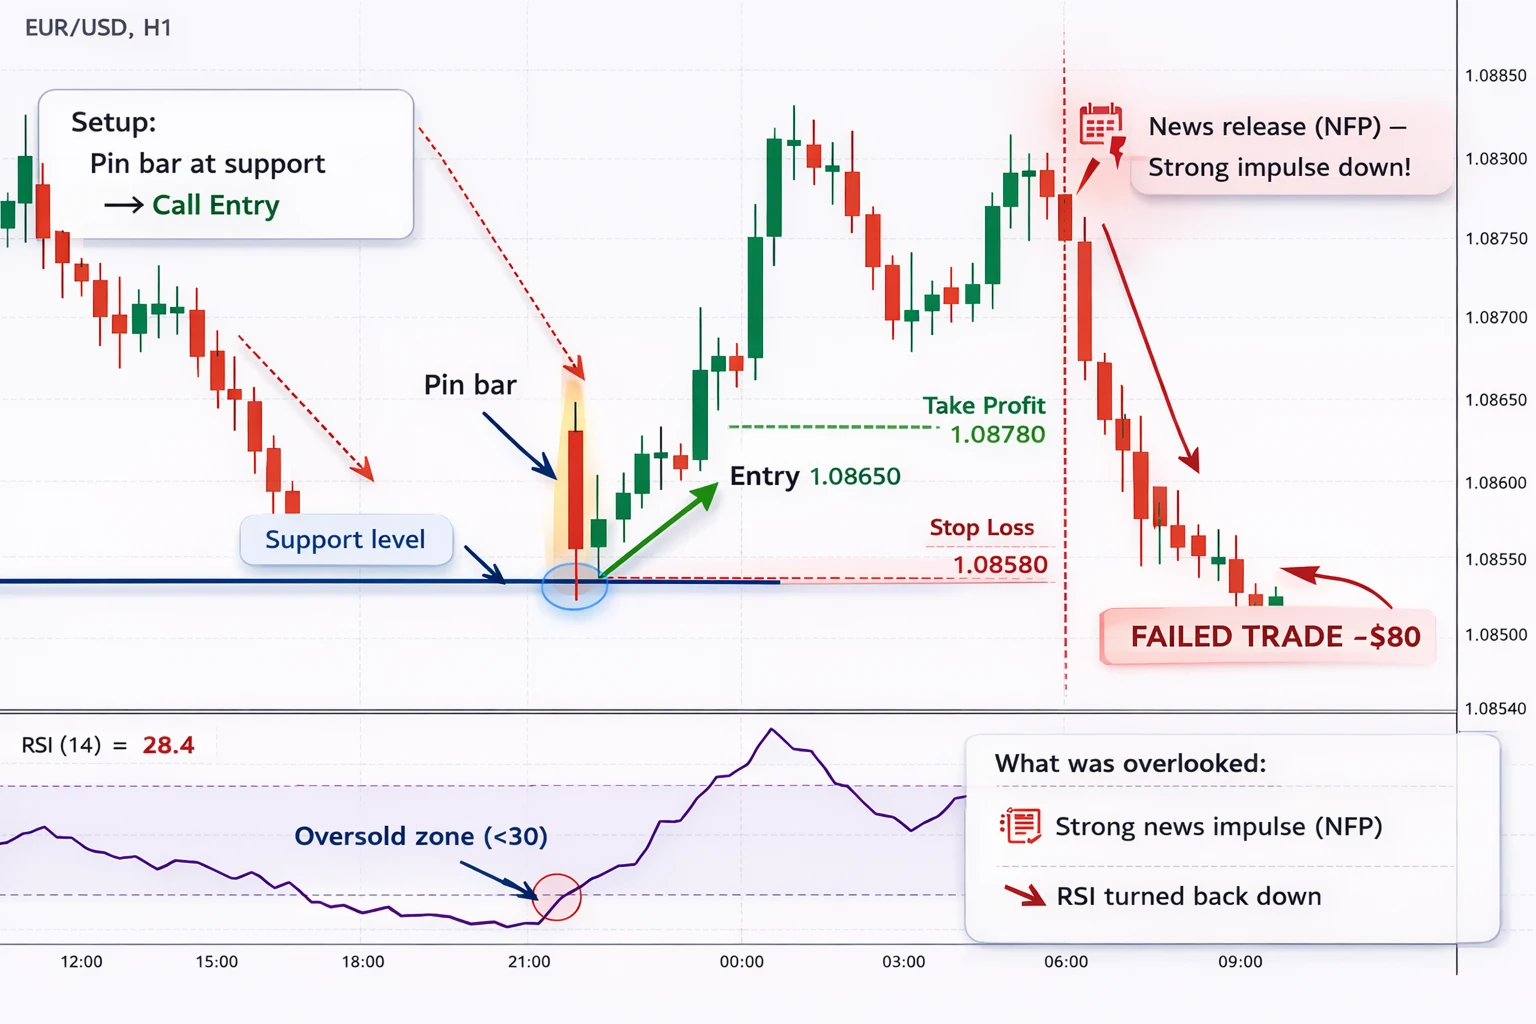
Pin bar. A candle with a small body and a long wick. If the long wick points down and the candle appears at support, the market rejected lower prices, so you can look for a Call entry. If the wick points up at resistance — Put entry. It is one of the clearest signals for beginners.
Engulfing. The second candle fully engulfs the body of the first. A bullish engulfing pattern (green candle swallowing a red one) at support is a Call signal. A bearish engulfing pattern (red candle swallowing a green one) at resistance is a Put signal. It shows a shift in initiative.
Doji. A candle with almost no body — price opened and closed at nearly the same level. A doji is not an entry signal by itself, but a pause signal. The market is thinking. If a doji appears at a level, wait for the next candle to confirm direction.
The key rule: a candlestick pattern only works in context. A pin bar in the middle of a trend without a level is not a signal. A pin bar at a strong level is a different story.
If you want a deeper breakdown with examples and typical mistakes, there is a separate guide on candlestick patterns for binary options.
Entry points based on indicators
Indicators are mathematical formulas placed on the chart. They do not predict the future, but they help you assess the current situation. Here are four core ones that are enough to get started.
RSI (Relative Strength Index). Shows how overheated the market is. Below 30 — oversold zone (a reversal upward may be possible). Above 70 — overbought zone (a reversal downward may be possible). One important detail: in a strong trend, RSI can stay in an extreme zone for a long time, and that does not automatically mean a reversal. That is why RSI works better in ranges.
Moving Average (MA). Shows the average price over a certain period. If price is above the MA, the trend is more likely up. A crossover of a fast MA (for example, MA 10) and a slow one (MA 50) is a classic signal: fast crosses slow from below upward → uptrend; from above downward → downtrend.
Bollinger Bands. Three lines: the middle line (MA) and two outer bands that show a volatility corridor. Narrowing bands mean the market is quiet and an impulse may be coming. Widening bands mean movement is already underway. In a range, a bounce from the lower band can be a Call signal, and from the upper band a Put signal. But in a trend, price can ride the band for a long time, and the bounce setup may fail.
For a deeper explanation of how to read band contraction and expansion and build entries around them, see the article on Bollinger Bands in binary options.
MACD. Shows the relationship between two moving averages. When the MACD line crosses the signal line from below upward, that is a bullish signal. From above downward, it is bearish. The histogram shows the strength of the move. MACD is more often used as confirmation than as the main signal.
Important: do not put all four indicators on the chart at the same time. Two is the maximum. Otherwise, they will start contradicting each other and you will end up with analysis paralysis. All the indicators listed above are available for free on TradingView and in the Binarium terminal.
Entry points in a trend vs in a range — what is the difference
These are different market conditions, so the entry strategies for them are different too.
Trend entry. The main idea is not to enter at the top of the move, but to wait for a pullback. Trend is going up → price pulls back to a support level or a moving average → a signal appears (pattern, RSI) → enter Call in the direction of the trend. Trading with the trend is the safest approach for beginners because you are trading with the flow.
Range entry. The idea is that price moves between two levels (a channel). It approaches the lower boundary — enter Call. It approaches the upper boundary — Put. Range trading works as long as the channel is still valid. Once price breaks one of the boundaries, the channel is broken and the situation must be reassessed.
The most common beginner mistake is entering against the trend. Price is falling, someone thinks “it has already dropped enough,” and enters Call. Then price keeps falling. A trend can last much longer than it seems. If you do not see clear reversal signals with confirmation, do not step in against the direction of the move.
Entry points around news
News trading is a separate topic. The idea is simple: before major data releases, the market can make sharp moves.
The most dangerous news events: Non-Farm Payrolls, Fed or ECB rate decisions, inflation data (CPI), quarterly GDP. In the economic calendar, these are usually marked with three icons — the highest impact level.
What the reaction looks like in practice: say US CPI comes out below forecast. The dollar weakens, so EUR/USD rises. But in the first 5–10 minutes, price can swing in both directions before picking one. That is exactly where beginners get trapped, trying to jump into the move.
A practical rule: do not trade your regular technical setups 30 minutes before or 30 minutes after a major news release. At those moments, the market is not driven by the chart, but by crowd emotion. If you want to trade news, treat it as a separate strategy with different rules and longer expiration times (from 15 minutes).
Ready-made setups: 3 combinations for finding an entry point
Each method above is useful, but on its own it gives a weak signal. Real reliability comes from combinations, when two or three tools confirm each other. Below are three specific setups with entry rules, expiration, and notes on when the combination breaks down. In practice, these are the precise entry points — not magical signals, but clear combinations where every condition can be checked.
Setup 1 — Bounce from a level + pin bar + RSI
This is the simplest and clearest setup. It is ideal for traders who are just learning how to find an entry point in binary options.
Conditions for a Call entry (up):
- Price reaches a support level (a zone it bounced from before).
- A pin bar forms with a long lower wick (the market tried to break the level but failed).
- RSI is below 30 (oversold zone — an argument that the decline is running out of steam).
Conditions for a Put entry (down): the mirror version — resistance, pin bar with an upper wick, RSI above 70.
Timeframe: M5. Expiration: 15–25 minutes. When it does not work: in a strong downtrend, the support level may simply fail to hold. If the higher timeframe (M15 or H1) shows a clear downtrend, it is better to skip the trade.
Example (illustrative). EUR/USD, M5. Price falls to the 1.0850 zone — a level the market bounced from twice in the last 24 hours. A pin bar forms: small body, 14-point lower wick, close above the open. RSI at that moment = 28. Two arguments line up → Call entry, 20-minute expiration. After 15 minutes, price moves to 1.0868 — the trade is in profit.
This example is based on a typical situation. The numbers will be different on your asset. Always test the setup on demo before trading live.
Setup 2 — Trend + pullback to MA + Bollinger Bands
This setup works when the market is in a clear trend and you are looking for an entry in the direction of that trend.
Conditions for a Call entry (uptrend):
- The uptrend is confirmed: price is above MA 50, and the MA itself slopes upward.
- Price pulls back and reaches the lower Bollinger Band or touches the MA.
- The next candle is bullish (closes above the open), confirming the bounce.
Timeframe: M15. Expiration: 45–75 minutes. When it does not work: in a range (Bollinger Bands are narrow, MA is flat) or during a sharp impulsive trend reversal.
Example (illustrative). GBP/USD, M15. The market is in an uptrend: price is consistently above MA 50, and MA points upward. Price pulls back and touches the lower Bollinger Band near 1.2710. The next candle is bullish, with a solid body, closing at 1.2728. MA 50 at that moment is near 1.2720. Call entry, 60-minute expiration. After 45 minutes, price is at 1.2755 — the trade is in profit.
The numbers are illustrative. Your asset and market conditions will differ.
Setup 3 — Level breakout + MACD
This setup is for traders who want to catch the start of a new move. It is harder than the first two because false breakouts are common.
Conditions for a Call entry:
- Price breaks a resistance level — the candle closes above the level (not just pierces it with a wick, but actually closes above it).
- MACD confirms it: the MACD line crosses the signal line from below upward, and the histogram is growing.
Timeframe: M5–M15. Expiration: 15–45 minutes. When it does not work: if price breaks the level but quickly returns back below it — that is a false breakout. If MACD does not confirm, it is better to skip the entry.
Example (illustrative). USD/JPY, M5. Price has been stuck below the 151.20 resistance level for several hours. The next candle closes at 151.28 — above the level, with a full body and no long upper wick. MACD: the line crosses the signal line from below upward, and the histogram turns positive. Call entry, 20-minute expiration. After 15 minutes, price is at 151.42 — the breakout is confirmed.
A false breakout would look like this: the candle closes above 151.20, but the next one immediately drops back below it. MACD would not confirm either. That entry is better skipped.
Setup comparison
| Setup | Market | Timeframe | Expiration | Complexity |
|---|---|---|---|---|
| 1. Level + pin bar + RSI | Range / range boundaries | M5 | 15–25 min | Low |
| 2. Trend + MA + Bollinger | Clear trend | M15 | 45–75 min | Medium |
| 3. Breakout + MACD | Breakout from consolidation | M5–M15 | 15–45 min | High |
You do not need to master all three at once. Start with the first one — it is the easiest to understand. Once you can confidently find entries with it on a demo account, add the second one. Remember: precise entry points do not come from a secret indicator, but from the same sequence every time: level → signal → confirmation → expiration. A Binarium demo account is a convenient place to test all three setups — the TREND promo code gives you +100% on your first deposit when you switch to live trading.
Expiration and timeframe: how to connect them to the entry point
Which timeframe should you use to search for entry points
M1 (one-minute candles) is a trap for beginners. There is too much noise, too many false signals, and too much chaotic movement. Levels on M1 get broken every few minutes. If you trade turbo options on M1, be ready for a high number of false signals.
M5 (five-minute candles) is a practical option for short-term trades. There is enough movement for patterns to be readable, and enough calm for levels to work. Recommended expiration: 15–25 minutes.
M15 (fifteen-minute candles) offers a calmer pace. Signals are less frequent but more reliable. It suits traders who do not want to sit in front of the monitor every minute. Recommended expiration: 45–75 minutes.
H1 (hourly candles) is for patient traders. Signals appear even less often, but their quality is usually higher. Expiration — from 3 hours.
Best recommendation for beginners: M5 or M15. And always check the context on the higher timeframe. If you trade on M5, look at M15 and H1 too. If you see a Call signal on M5 but H1 shows a strong downtrend, that signal is weak.
How to choose expiration for the signal
| Timeframe | Recommended expiration | Number of candles | Best for |
|---|---|---|---|
| M1 | 3–5 minutes | 3–5 candles | Experienced traders, not beginners |
| M5 | 15–25 minutes | 3–5 candles | Beginners and intermediate traders |
| M15 | 45–75 minutes | 3–5 candles | Those who prefer a calmer pace |
| H1 | 3–5 hours | 3–5 candles | Patient traders, swing approach |
The “3–5 candles” rule is not a law — it is a reference point. The idea is to give the signal enough time to play out. If expiration is too short, price may not have time to reach the move. If it is too long, the market may reverse before the trade closes.
Typical mistakes when searching for an entry point
These are eight mistakes that nearly all beginners make. If you recognize yourself here, that is normal — it is part of learning. The key is to understand them and fix them.
1. Entering after an impulse. Price shoots up, and you rush to buy Call because “the trend is up.” But the impulse has already happened. Entering at the top of the move means buying at the worst possible price. The right move is to wait for a correction (pullback) and only then look for an entry.
2. Ignoring the higher timeframe. You found a perfect pin bar on M5 and entered Call. But on H1 there is a powerful downtrend, and your “perfect pin bar” is just a tiny pullback inside a broader drop. Always check context.
3. Entering without confirmation. You saw one candle or one indicator reading and clicked right away. One argument is not an entry — it is hope. Wait for the second one.
4. Overloading the chart with indicators. RSI, MACD, Stochastic, Bollinger Bands, three moving averages, and a couple of channels — all at once. Indicators start to contradict each other and you get confused. Two indicators maximum.
5. Trading emotionally after a losing streak. Three losing trades in a row — and you double the stake to win it back. That is Martingale, and it destroys deposits. After a losing streak, pause and review — do not revenge trade.
6. FOMO — fear of missing the move. Price starts rising, you missed the entry, and now you jump into the moving train. Most often, the train turns around right after your entry. A missed trade costs 0. A losing trade costs your stake.
7. Random expiration. The signal is on M15, but you choose 60 seconds “because that is what you are used to.” An M15 signal cannot play out in one minute. Expiration is part of the entry, not a random setting.
8. Chasing the number of trades. It feels like more trades means more profit. In reality, the opposite is true. Three to five well-thought-out entries per session will usually do more than 20 random clicks. If conditions are not there today, it is better not to trade. The market will still be there tomorrow.
Checklist before entering a trade
Save this list and review it before every entry — until it becomes second nature.
Checklist: 8 points before a trade
- ✅ Did I define the market phase (trend / range / chaos)?
- ✅ Did I check the higher timeframe for contradictions?
- ✅ Did I mark a level or zone (support / resistance)?
- ✅ Is there a candlestick pattern or indicator signal?
- ✅ Is there confirmation (a second argument)?
- ✅ Did I choose expiration based on the 3–5 candle rule?
- ✅ Is my stake size within acceptable limits (% of deposit)?
- ✅ Is there no major news release in the next 30 minutes?
→ If the answer to even one item is “no” or “I do not know” — do not enter.
Even the perfect entry point will not save you if your stake size is reckless. How to calculate position size and trading limits is explained in the article on money management in binary options.
Where to practice: demo account
Test all the setups from this article on a demo account first. Do not jump into a real deposit after one lucky day.
A demo account is not there just for show. You need it to learn how to spot patterns in real time instead of on ready-made screenshots, get used to the sequence “phase → level → signal → confirmation → entry,” and, maybe the hardest skill of all, learn how to wait.
How long should you practice on demo? That depends on you. At minimum, until you can follow your algorithm consistently without telling yourself, “okay, just this one time without confirmation.” If you trade on demo as chaotically as before, it is too early to switch to real money.
You can open charts for free on TradingView — it has all the indicators mentioned above. If you still have not figured out the broker platform, here is a step-by-step beginner guide to Binarium. To open a demo account, you need an account — registration on Binarium takes just a couple of minutes, and the TREND promo code gives you +100% on your first deposit when you are ready to go live.
FAQ — common questions about entry points
What is an entry point in binary options in simple terms?
It is the moment when the conditions in your algorithm line up for opening a trade: you identified the market phase, found a level, saw a signal with confirmation, and checked the risk. It is a deliberate decision, not a random click.
Can you guess an entry point without analysis?
Technically, yes — you can press the button at any moment. But because binary options have negative expectancy, guessing leads to losses even with a 50% win rate. More on this — at the beginning of the article.
Which indicator shows the best entry point?
There is no universal one. RSI is useful in a range, moving averages work well in a trend, and Bollinger Bands help estimate volatility. The practical solution is to combine two tools instead of searching for “the one perfect” indicator.
Which timeframe should a beginner use to find entry points?
M5 or M15. One-minute charts have too much noise. On M5, signals are readable and expiration feels comfortable (15–25 min), while M15 gives an even calmer rhythm. The full table is in the “Expiration and timeframe” section.
Why does a signal look correct but the trade still loses?
Usually because the context was not checked. A pattern on M5 may be “correct” by itself, but if H1 is trending against you or major news is due in 5 minutes, the level may fail. A detailed breakdown is in the mistakes section.
How many trades per day is normal?
Three to five justified entries per session. If the right conditions are not there, it is better not to trade at all. Quantity without quality is a direct path to draining your deposit.
How do you connect expiration to the entry point?
Expiration is tied to the timeframe, not to habit. On M5, the reference point is 15–25 minutes; on M15, it is 45–75 minutes. Using a 60-second expiration for an M15 signal is almost guaranteed to fail. The table with examples is here.
What should I do if I am unsure — enter or wait?
Wait. Doubt means not all checklist conditions are met. A missed trade costs 0. A losing trade costs your stake. The market will give you another chance, but it will not refund an impulsive click.
Can the search for entry points be automated?
Partly. There are bots that trade based on preset rules. But a bot does not see context the way a human does: it cannot always tell a clean setup from an entry right before a news release. If you are interested, see how the trading bot for Binarium works. But first, learn how to enter manually.
Where can I watch real-time examples of entries?
You can connect to the free Telegram signals and watch the logic behind the trades. Do not copy blindly — use them as learning material to see how others find entry points and what they pay attention to.
Ready to put this into practice?
Fund your Binarium account and use the promo code TREND to get a +100% bonus and test the strategy.