Technical Analysis for Binary Options: How to Analyze the Market Before a Trade

Promo code: TREND (+100% on your first deposit)
Technical analysis in binary options is not about finding a magic indicator or guessing. It's a clear sequence of steps before every trade: identify the market phase, mark key levels, wait for a signal, check confirmation, and only then choose the expiration. In this guide we'll walk through the entire algorithm step by step — from reading the chart to a ready-to-use checklist.
If you're just starting out, it's useful to go through the basics first — trading from scratch: where to begin, so you don't end up building a system out of random tips.
What Is Technical Analysis for Binary Options in Simple Terms
Technical analysis for binary options is a way of making decisions based on the price chart rather than emotions. You observe how the price behaves, where it accelerates, where it slows down, where it reacts to levels — and whether there's logic for an entry.
In binary options this is especially important because typical beginner mistakes look like this:
- entered against the trend;
- picked a random expiration;
- saw a "nice candle" without context;
- jumped in after an impulse out of fear of missing the move;
- overloaded the chart with indicators and got confused.
To avoid drowning in tools, first understand the basic logic of charts and indicators in the charts and indicators in trading section, and only then add complex combinations.
Technical vs. Fundamental Analysis: What's the Difference for Binary Options
In trading, two approaches are commonly used:
- technical analysis — working with the price chart, levels, candlesticks, and indicators;
- fundamental analysis — working with news, events, and the overall market backdrop.
For short-term binary options trades, technical analysis is used more often because it helps identify the entry point here and now. But an important note: news doesn't disappear. During a major event the market can accelerate sharply and break even a careful signal.
A simple rule: the chart is responsible for the entry, news is responsible for caution.
And if you notice that during news or impulses you start entering impulsively, that's no longer about indicators — it's about trading psychology.
Technical vs. Fundamental Analysis in Binary Options Context
| Criterion | Technical Analysis | Fundamental Analysis |
|---|---|---|
| What it studies | Price chart, candlesticks, indicators | News, economic events |
| Horizon | Short and medium-term trades | Medium- and long-term decisions |
| Applicability in BO | Primary tool | Filter / warning |
| Difficulty for beginners | Medium (requires practice) | High (requires context) |
| Main risk | Entry without context | Delayed reaction |
Where to Start Technical Analysis of the Binary Options Market Before a Trade
Real technical analysis starts not with an indicator, but with a sequence of steps.
Step-by-Step Algorithm (Working Foundation)
- Choose an asset. Don't jump between 10 instruments. At the start it's better to stick with 1–2 assets so you can understand their behavior.
- Open a candlestick chart. Candlesticks are usually more convenient than a line: you can see impulse, wicks, and reactions to zones.
- Check the higher timeframe (context). Not just "for the sake of it," but to avoid entering against the overall move. This is especially important in intraday trading on binary options, where the market changes quickly.
- Identify the market phase. Trend, range, or chaos. If this step is skipped, signals become harder to read.
- Mark levels/reaction zones. Don't draw 15 lines. You only need the key zones where price has already reacted.
- Wait for a signal. Candlestick reaction, bounce/breakout, filter confirmation — but not an "entry by feel."
- Check for confirmation. A single signal on its own is a weak reason. You need an answer to the question: "Why exactly here?"
- Choose the expiration based on the scenario. Not by habit and not "like yesterday."
- Check the risk and only then enter. Even a good setup won't save you without proper money management and risk control.
Don't move to the next step until you've answered the previous one. For example: if you can't tell whether it's a trend or a range — it's too early to look for an entry; no level — too early to discuss a signal; no confirmation — too early to choose an expiration.
You can test this algorithm on a real chart on the Binarium platform. When registering, use the promo code TREND — you'll get a +100% bonus on your first deposit and can practice each step hands-on.
Pre-Entry Checklist (Short Version)
- I understand the current market phase (trend / range / chaos)
- There is a clear zone/level
- There is a signal
- There is confirmation
- Expiration is chosen based on logic, not on autopilot
- Risk is under control
- If the signal is weak — I'm ready to skip the trade
Charts for Technical Analysis: What to Look At in Binary Options
Line Chart
Good for a quick overview of direction, but hides a lot of important detail: wicks, candle structure, price reaction within a move.
Bars
More informative than a line chart, but often visually harder for beginners. If you're just starting, there's no need to overcomplicate things.
Japanese Candlesticks
The most convenient format for most beginners. On candlesticks you can see: the strength of a move, reaction to a level, deceleration or acceleration, as well as candlestick patterns (but only in context).
Once you've mastered the basics, it makes sense to move on to candlestick patterns and chart analysis.
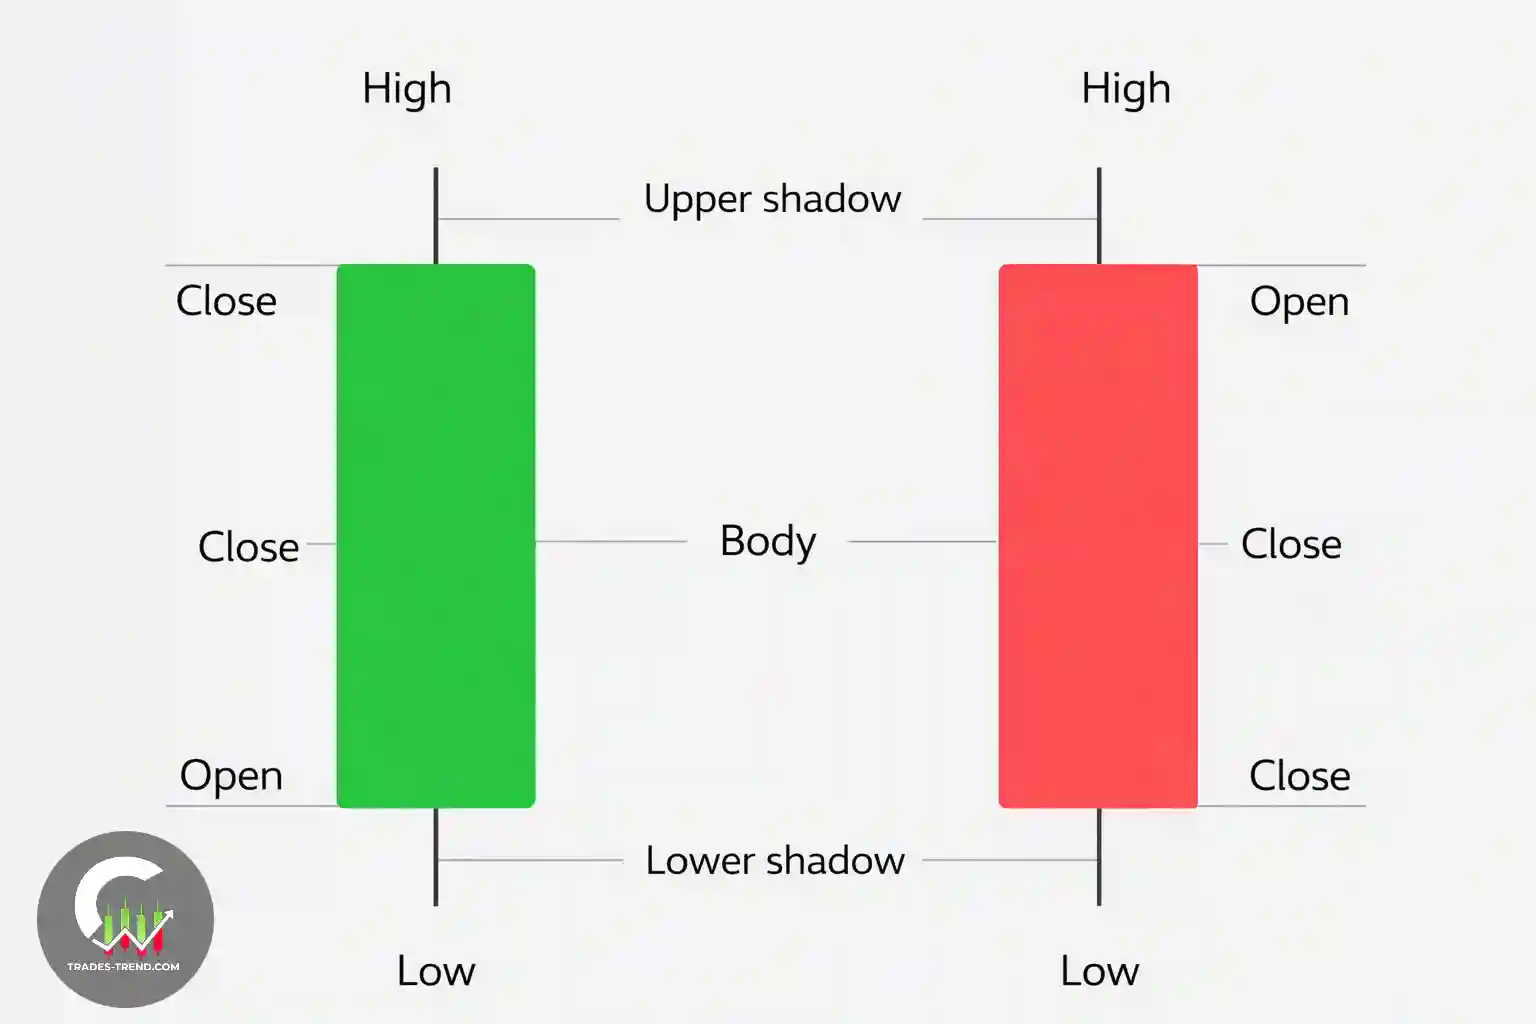
Which Chart Should a Beginner Choose
| Chart Type | Simplicity | Informativeness | Recommendation |
|---|---|---|---|
| Line | High | Low | Overview only |
| Bars | Medium | High | Optional |
| Japanese Candlesticks | Medium | High | Best choice |
Timeframes in Binary Options Technical Analysis
One of the most common mistakes is analyzing the market on just one timeframe and assuming the picture is clear.
Why You Need a Higher Timeframe
The higher TF helps you understand the background: is there a trend, where are the key zones, is the price running into an important level. Without this, on the lower TF you can easily see a "nice candle" that in reality is just noise.
Why You Need a Working Timeframe
The working TF is for finding the entry point and confirmation. This is where you decide whether the trade is there or it's better to skip it.
On shorter TFs there's more noise. If you're drawn to very fast entries, it's useful to understand the risks associated with scalping on Binarium: there are plenty of signals, but quality depends on filtering.
How to Link Timeframe and Expiration
There's no universal number. The working logic is: a fast scenario (short impulse, sharp bounce) usually requires a shorter horizon; a slow scenario (prolonged consolidation near a level) needs more time for the idea to play out. The key is not to choose expiration "out of habit."
Working with Timeframes Without Chaos
| Higher TF | Working TF | Purpose |
|---|---|---|
| H1 | M5–M15 | Short intraday trades |
| H4 | M15–H1 | Medium-term analysis |
| D1 | H1–H4 | Positional trading |
Market Basics: Trend, Range, Impulse, Pullback
Without understanding the market state, any chart and any indicator will only cause confusion.
Trend
Price moves directionally; pullbacks exist but don't break the overall structure. A common beginner mistake is trying to catch a reversal "because the price is already too high/low."
Range (Sideways)
Price moves within a range. In this phase, trading from the range boundaries often works, but only if it's truly a range and not erratic chaos.
Impulse
A sharp acceleration of movement. This is exactly where the urge to "jump in" kicks in. This is no longer just about technique, but also about FOMO in trading.
Pullback
A temporary move against the main impulse or trend. Often, traders look for cleaner entries on pullbacks — but only with confirmation.
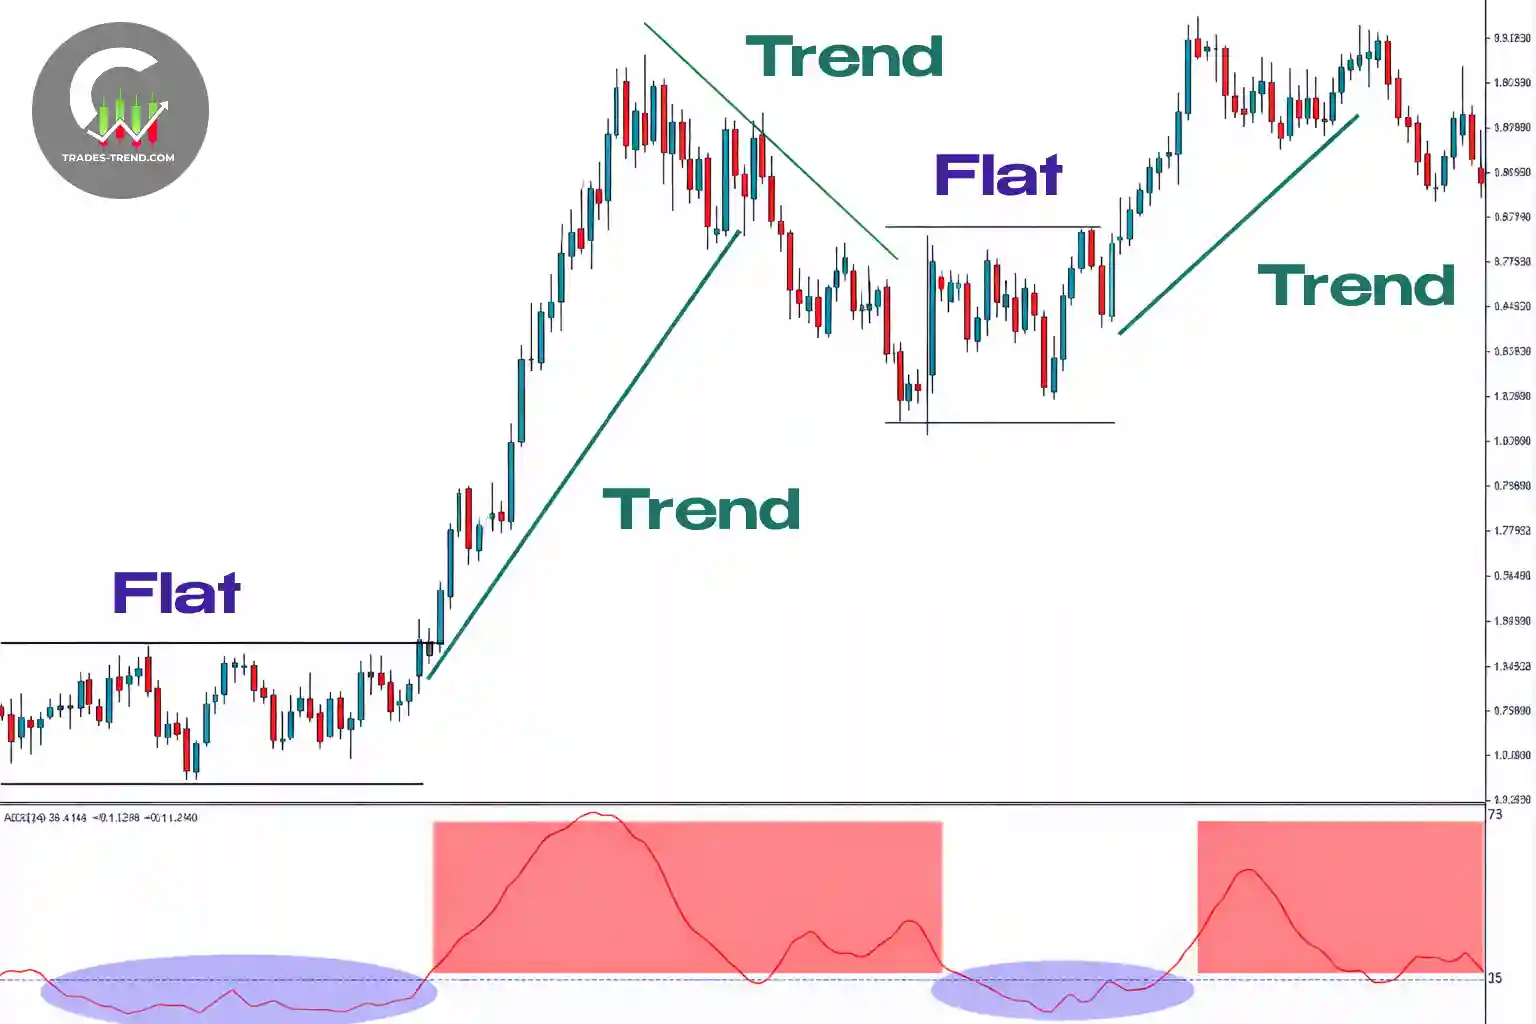
Market Phase and Signal Approach
| Phase | Approach | What to Avoid |
|---|---|---|
| Trend | Entry in the direction on pullbacks | Catching reversals without reason |
| Range | Trading from range boundaries | Trend entries in the middle of the range |
| Impulse | Wait for pullback/confirmation | "Jumping in" on emotions |
| Chaos | Skip the trade | Any attempt to find logic |
Support and Resistance Levels in Binary Options
Levels are one of the most useful tools for a beginner. They help you understand where a signal makes sense and where it's just a random move.
A level is more often a zone than a pixel-perfect line.
How to Draw Levels Without Self-Deception
- mark zones where price has already reacted noticeably;
- don't draw a level at every local extreme;
- don't "fit" the level to a result that already happened;
- keep only what's important on the chart.
Bounce and Breakout: How Not to Confuse Them
Bounce — price reached a zone and showed a reaction in the opposite direction. Breakout — price passed through the zone and confirms the move. Between them there's often a false breakout — that's where the combination of level + context + confirmation helps.
If you want to understand impulse zones and price acceleration more deeply, study the topic of imbalance (FVG) in trading.
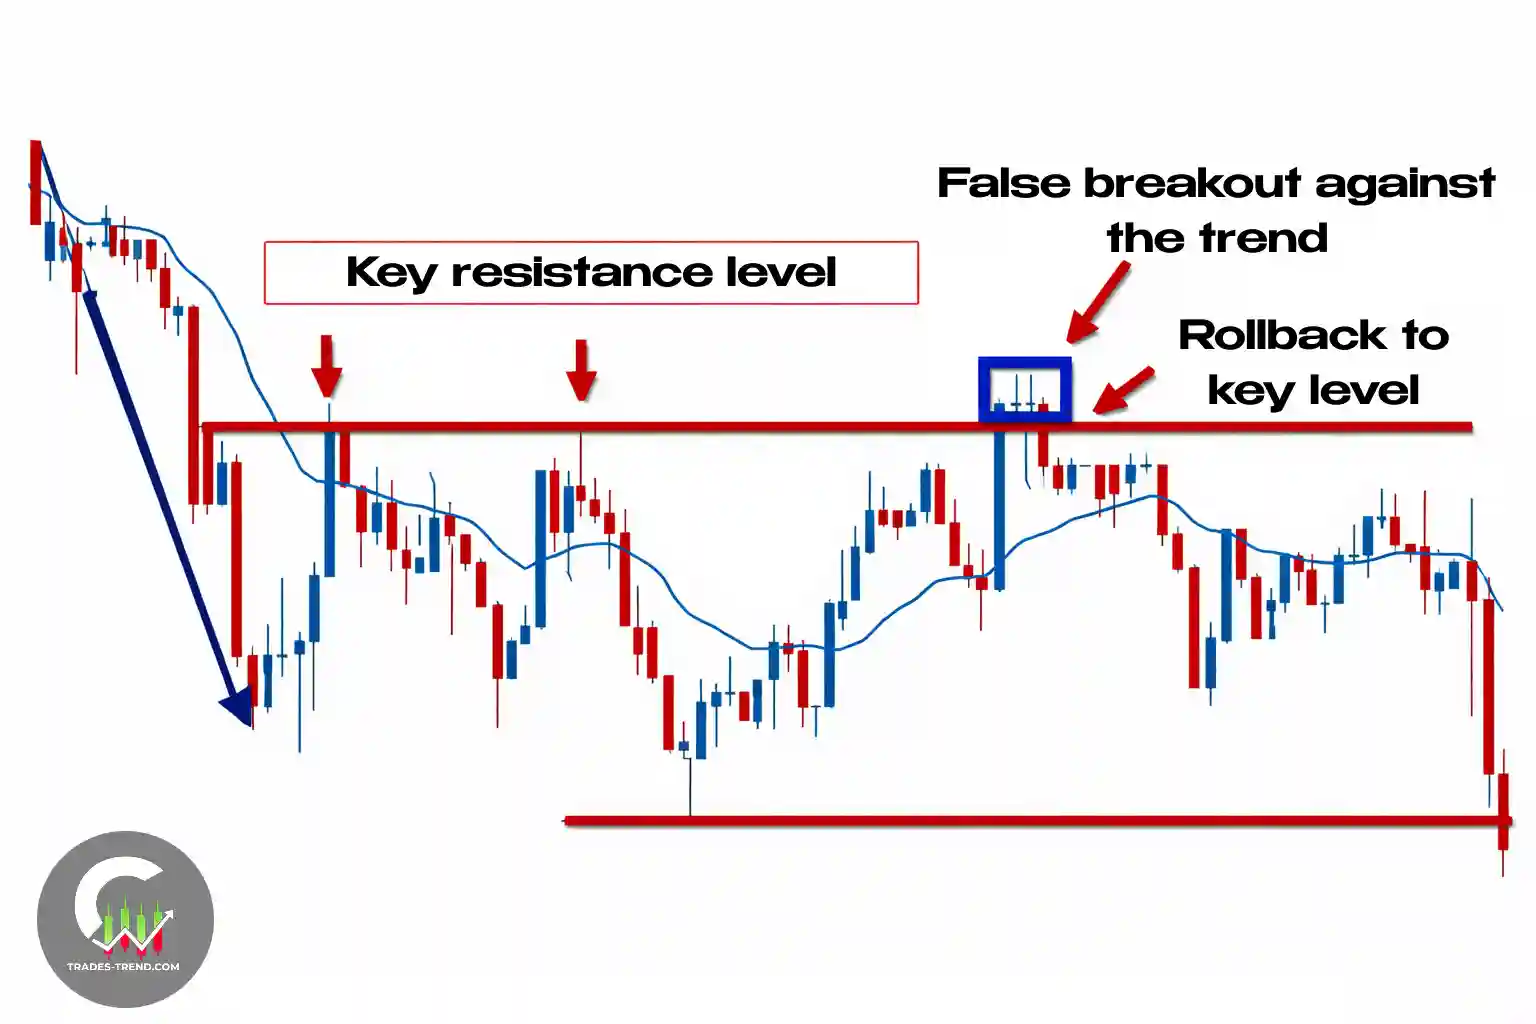
Common Mistakes with Levels
- too many lines on the chart;
- entering immediately on a touch without confirmation;
- ignoring the market phase;
- working only off the level without a signal.
Candlestick Analysis in Binary Options Technical Analysis
Candlestick analysis is useful, but works best as a filter and confirmation rather than a standalone "entry button."
What a Beginner Needs to Know
At the start, 3–5 patterns are enough: pin bar, engulfing, doji, hammer/hanging man. The point is not in the number of names, but in the question: what does this pattern confirm at the current point on the chart?
Why a Pattern Without Context Gives a False Signal
The same pattern near a strong zone, in the middle of a range, after news, and in a chaotic market will have different value. So the working rule is simple: context and zone first, then the candle.
If you want to expand on the topic of patterns, it's convenient to connect it with larger structures, such as the head and shoulders pattern, but only after mastering basic candlesticks.
Pattern and Context
| Pattern | At a Strong Zone | In the Middle of a Range | After News |
|---|---|---|---|
| Pin bar | Strong signal | Weak | Unreliable |
| Engulfing | Strong | Medium | Unreliable |
| Doji | Needs confirmation | Noise | Noise |
Indicators in Technical Analysis: What a Beginner Really Needs
The most common trap: putting 5–7 indicators on the chart and thinking it "strengthened the analysis." Usually it only makes the picture heavier.
A Working Approach for Getting Started
It's better to take: 1 tool for understanding direction, 1 filter, and 1 tool for assessing volatility (optional).
Basic Indicators (Without Overload)
- MA (Moving Average) — helps you see the direction and smooths out noise.
- RSI / Stochastic — suitable as a filter, but not as the sole signal.
- MACD — helps spot momentum and weakening.
- Bollinger Bands — help assess volatility and market phase.
Important: an indicator does not replace levels and market phase. It helps make a decision, but it doesn't make it for you.
Indicator → Benefit → Beginner's Mistake
| Indicator | Benefit | Common Mistake |
|---|---|---|
| MA | Trend direction | Entry only on crossover without context |
| RSI | Overbought/oversold filter | Using it as the only signal |
| MACD | Momentum assessment | Lagging on short TFs |
| Bollinger Bands | Volatility, contraction/expansion | Entry "from the band" in a range without confirmation |
Volume in Binary Options Technical Analysis: What You Need to Understand
This section is short but useful. Volume in binary options is often interpreted with too much confidence, even though there are nuances.
You can see real volume (if available in a particular source/market) and tick volume (the frequency of price changes). These are not always the same thing. That's why volume is better used as an additional reference point, not as the "final authority."
If you're looking for a convenient chart and service for analysis, check the trading tools and platforms section — it helps you set up your workspace without unnecessary noise.
Real vs. Tick Volume
| Volume Type | What It Shows | Reliability |
|---|---|---|
| Real volume | Number of trades/contracts | High (on exchange markets) |
| Tick volume | Frequency of price changes | Medium (indirect indicator) |
Binary Options Technical Analysis Online: How to Set Up Your Workspace
The point of "online" is not just opening any chart, but setting up a clear workspace that you can consistently work with every day.
Minimal Setup for Online Analysis (Without Overload)
Open a live chart and configure: candlestick format, a higher timeframe for context, a working timeframe for the entry point, 2–3 levels/zones, 1–2 indicators maximum, and a clean screen without a "zoo" of tools.
This working minimum is enough to test ideas, keep a journal, and learn to read the market — not just a pretty picture. You can put this approach into practice conveniently on Binarium — the platform lets you quickly configure the necessary parameters and start analyzing the market. And with the promo code TREND you'll get +100% on your deposit for full-scale testing.
What to Check Before Using a Chart/Platform
- are the timeframes you need available;
- are the indicators you need available;
- is it convenient to set levels;
- does the chart lag;
- is the interface up to date.
If you want to continue expanding your knowledge, a convenient path is through all trading articles, picking up materials on patterns, risk, and psychology as you practice.
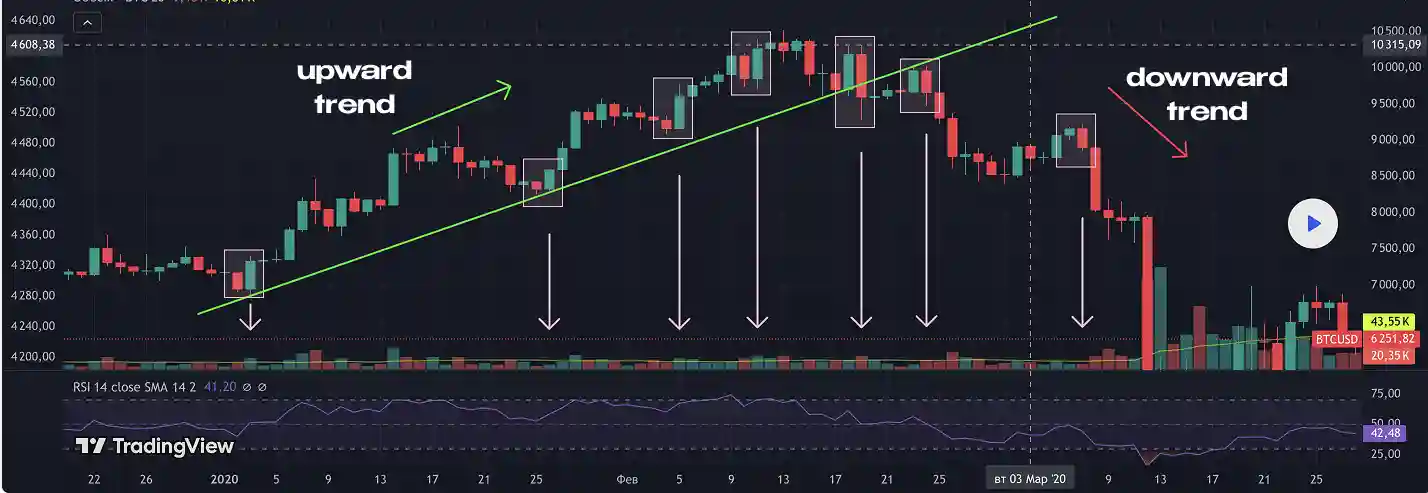
Mini-Example: What Technical Analysis Looks Like Before an Entry
Below is not a "signal," but an example of the logic:
- On the higher timeframe you can see the market moving directionally (there is a trend).
- On the working TF the price pulls back to a marked zone.
- A reaction appears in the zone (candle/confirmation).
- The signal is not against the overall move.
- Expiration is chosen based on the scenario's speed, not "out of habit."
- If there's no confirmation — the trade is skipped.
That's what normal technical analysis looks like: not "saw an indicator — pressed a button," but building a decision step by step.
Anti-Checklist: When It's Better to Skip the Trade
If 2–3 of the points below match — that's a good reason not to enter:
- I can't tell whether it's a trend or a range
- I don't have a clear zone/level
- There's a signal, but without confirmation
- I'm entering after an impulse "not to miss out"
- I'm choosing expiration by eye
- There are too many indicators on the chart and I'm confusing myself
- I can't explain my entry in 1–2 sentences
Common Beginner Mistakes in Binary Options Technical Analysis
Mistake 1: Analyzing only by indicator
What to do instead: first identify the market phase and mark levels, then use the indicator as a filter.
Mistake 2: Entering against the trend without reason
What to do instead: look for a scenario in the market's direction, or a very clear reversal setup with confirmation.
Mistake 3: Analyzing on just one timeframe
What to do instead: check the context on the higher TF, and the entry on the working one.
Mistake 4: Random expiration
What to do instead: match it to the scenario and the speed of the move.
Mistake 5: Emotional entries after a missed move
What to do instead: acknowledge the emotion and skip the trade if the logic is already gone. This is a matter of discipline and trading psychology, not a "bad market."
Mistake 6: No trade journal
What to do instead: keep a simple journal to see where the system breaks: the market, the signal, the expiration, or discipline.
Pre-Trade Checklist and Journal Template
Pre-Entry Checklist
- What is the current market phase?
- Where is the nearest zone/level?
- What specific signal do I see?
- What confirms it?
- Why was this particular expiration chosen?
- Is the risk too high?
- Am I entering based on a plan, not emotions?
Trade Journal Template
| Date | Asset | Market Phase | Signal | Expiration | Result | Comment |
|---|---|---|---|---|---|---|
| 03/28 | EUR/USD | Trend ↑ | Pin bar at zone | 15 min | + | Signal per plan |
| 03/28 | GBP/USD | Range | Bounce from boundary | 5 min | − | Didn't wait for confirmation |
The journal isn't for "reporting" — it's for analyzing your own mistakes. If you're just getting into the subject, a journal + a basic algorithm deliver more value than constantly switching strategies.
FAQ: Common Questions About Binary Options Technical Analysis
What is technical analysis for binary options in simple terms?
It's analyzing the price chart before a trade: market phase, levels, candlesticks, indicators, and signal confirmation. It helps you make decisions based on rules, not emotions.
Can you trade binary options using only technical analysis?
You can build your approach on technical analysis, but it's important to understand its limitations. Every signal needs to be tested in practice, and the market context must be considered.
What's more important for a beginner: levels or indicators?
It's usually more useful to first learn to identify the market phase and levels. Indicators are better added as a filter, not as a replacement for logic.
Why does technical analysis give false signals?
Because the market changes: trend, range, impulse, news, chaos. Often the problem is not the tool itself, but entering without context and confirmation.
What does "binary options technical analysis online" mean?
Usually it refers to analyzing a live chart through an online service or platform in real time. What matters more is not the service itself, but your analysis workflow and a clean workspace setup.
Do I need a trade journal if I'm just learning?
Yes. A journal quickly shows where your weak spot is: market phase, signal, expiration, or discipline.
Can I use multiple indicators at once?
You can, but at the start it usually does more harm than good. It's better to have 1–2 indicators with clear entry logic than an overloaded chart.
Conclusion: How to Use Technical Analysis Without Chaos
Technical analysis for binary options starts delivering results when you use it as a decision-making system, not as a collection of random signals.
The working chain looks like this: market phase → level → signal → confirmation → expiration → risk. If you build just this sequence, the quality of your decisions will noticeably improve.
Where to Start in Practice (Plan for the Coming Days)
- Choose 1–2 assets.
- Work only on a candlestick chart.
- Learn to distinguish a trend from a range.
- Mark levels as zones.
- Add 1 indicator filter.
- Use a checklist before entering.
- Keep a trade journal.
That's enough to move from "trading by eye" to proper practice. After that you can go deeper into strategies and practice and related analysis materials.
Ready to put your knowledge into practice?
Fund your account on Binarium and use the promo code TREND to get a +100% bonus and test your strategy.