Bollinger Bands for Binary Options: How to Read the Market and Enter with a Strategy

Promo code: TREND (+100% on your first deposit)
Bollinger Bands help you stop “guessing the button” and start seeing what state the market is actually in: compressing, accelerating, ranging, or moving in a strong trend. In binary options, this matters even more because the same indicator picture can mean either a rebound or continuation — and the mistake is usually not in Bollinger Bands themselves, but in reading the context incorrectly.
Important: indicators do not provide guarantees. They exist to help you read the market by rules and make more structured decisions.
If you are just getting into the topic, it helps to start with the basics first — trading from scratch: where a beginner should start — and only then build working indicator-based setups.
What Bollinger Bands are in simple terms
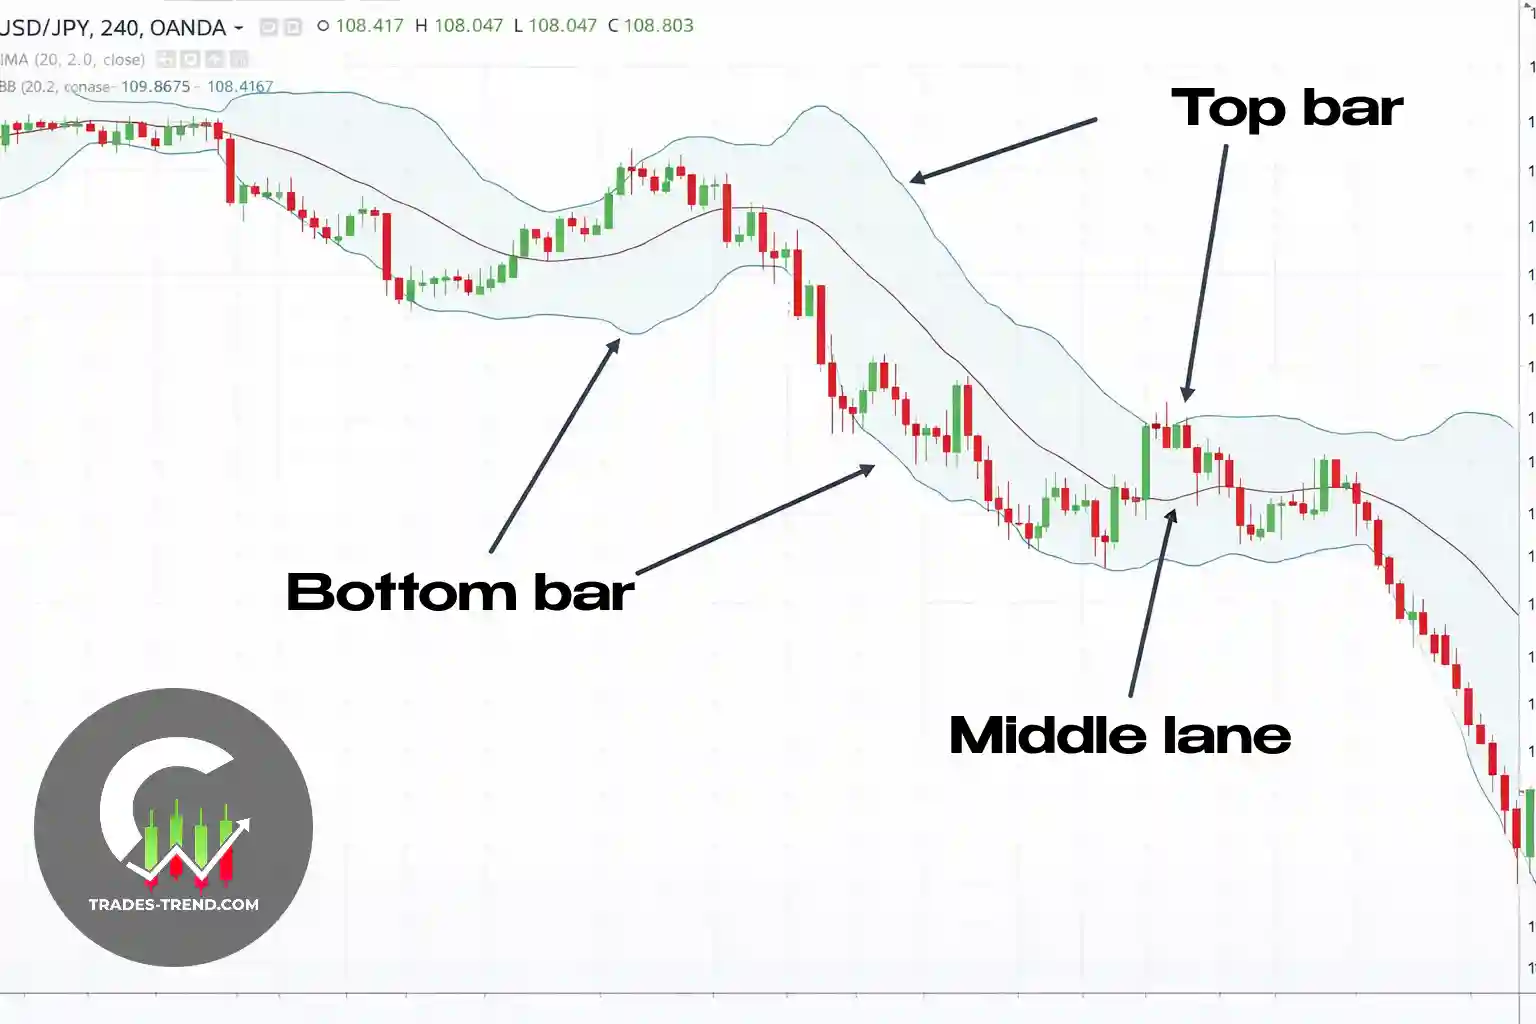
Bollinger Bands are an indicator made up of three lines:
- the upper band;
- the middle line;
- the lower band.
The middle line shows the average price movement, while the outer bands adjust to current volatility. That is why this tool fits naturally into the charts and indicators in trading section: it helps you see not only price direction, but also the current market state.
Why the bands contract and expand
- They contract when the market calms down and volatility drops.
- They expand when movement speeds up and the market becomes more active.
This is exactly why Bollinger Bands are useful in binary options: you assess not only where price is on the chart, but also the market’s current “temperature.”
Market first, signal second: how to read Bollinger Bands properly
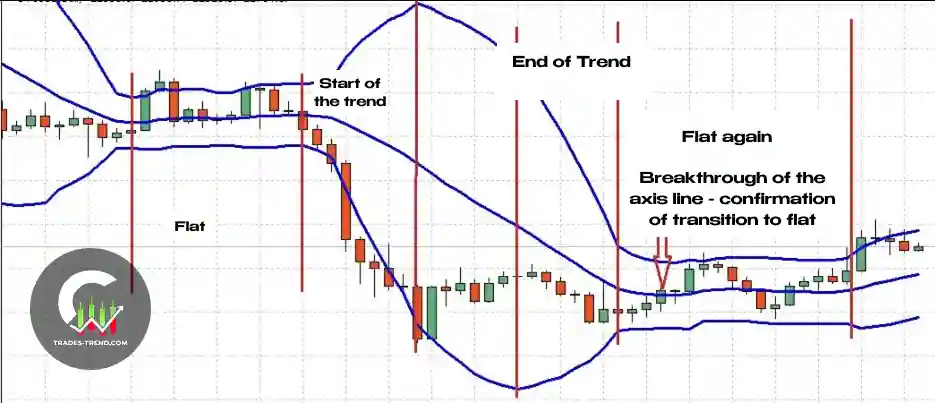
The most common beginner mistake is to treat a band touch as a ready-made entry. In practice, a touch is only a reason to check the context. First define the market phase: flat, trend, or chaos.
1) Flat market (range)
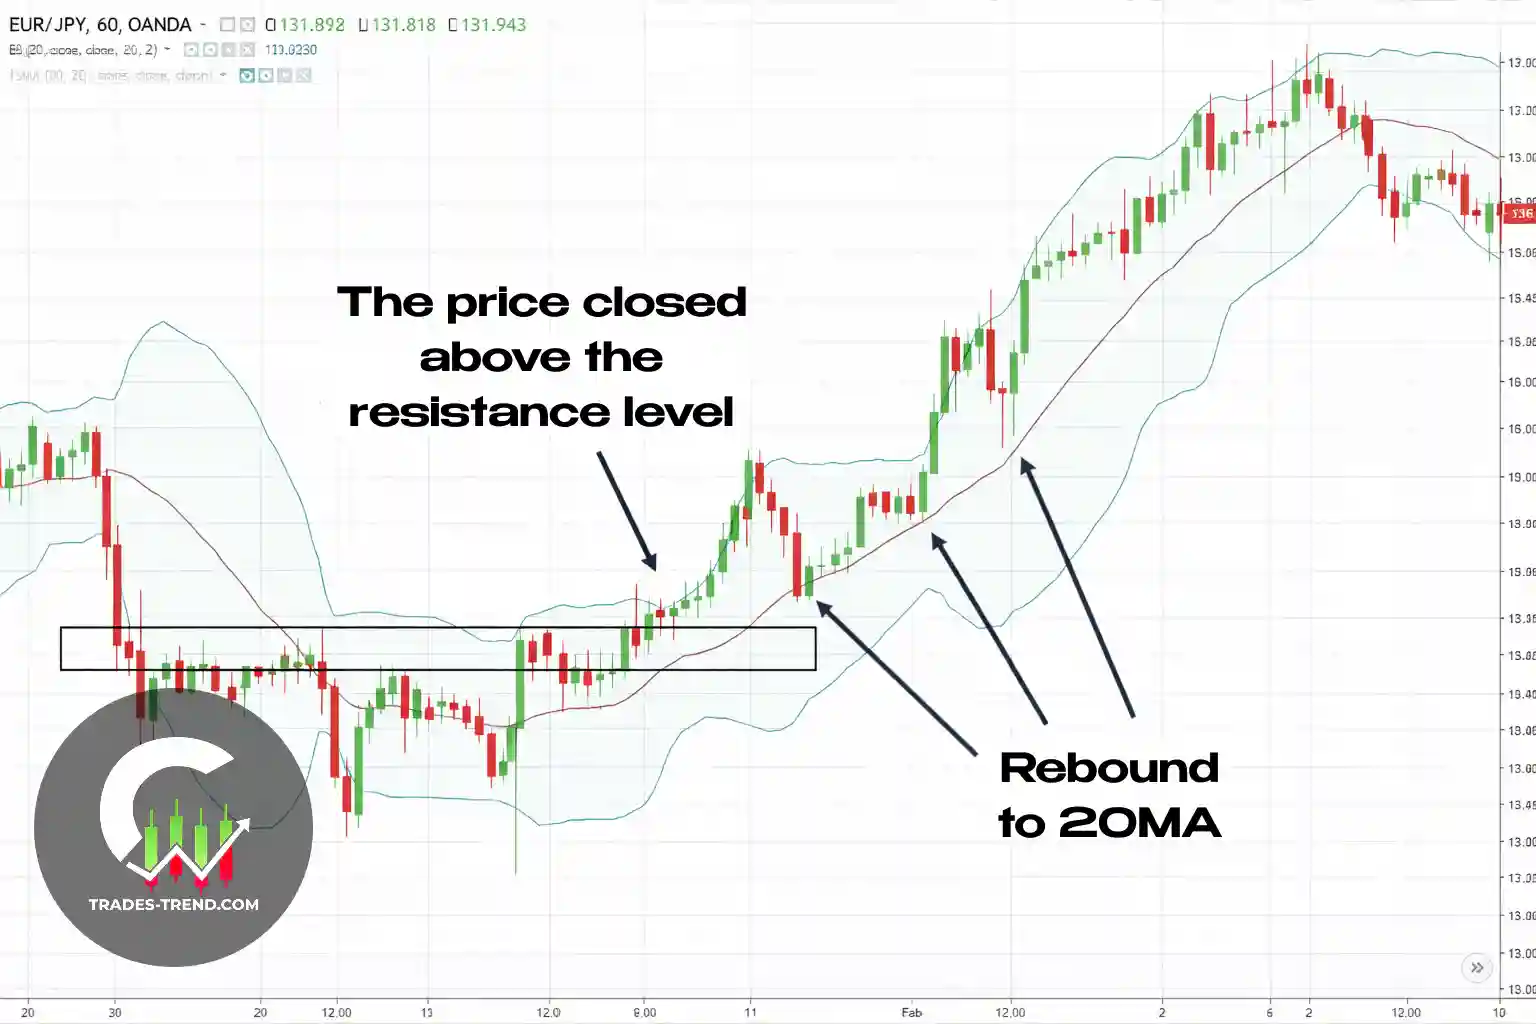
In a flat market, the bands often work as dynamic range boundaries. Here, rebound logic can indeed work better, but only if the range is clean rather than messy and nervous.
2) Trend
In a trend, Bollinger Bands more often show strength than a reversal point. If price is moving along the upper band, that is not an “urgent PUT,” but often confirmation of a strong upward move. It is useful to train this mechanic separately on examples from the article about intraday trading in binary options, where market pace matters a lot.
3) Chaotic market / news spikes
In these moments, BB can look beautiful, but signal quality drops sharply. You often get:
- false breakouts;
- sharp snapbacks;
- long wicks and spikes.
In chaos, skipping a trade is often more useful than forcing an entry at any cost.
Table: how to read BB in different market phases
| Market phase | What BB shows | What tends to work | What usually breaks the entry |
|---|---|---|---|
| Flat | Bands hold the range, price moves from one boundary to the other | Rebound from the band + confirmation | Entering on a single touch |
| Trend | Price can ride the band, bands expand | Trading with the trend, looking for pullbacks | Trying to catch a reversal on every touch |
| Chaos / news | Sharp expansions, spikes, snapbacks | Caution or skipping the trade | Emotional entries based on the picture alone |
Bollinger Bands settings for binary options: where to start
Beginners often search for “perfect settings,” but that is a trap. It is far more important to learn how to read the market consistently and execute the same setup the same way every time.
What to do at the start
- Begin with the default indicator settings in your terminal.
- Learn to identify the market phase.
- Only evaluate a signal after understanding the context.
- Wait for confirmation instead of entering on the first emotion.
- Match expiry to the logic of the setup.
What not to do
Do not change the parameters after every losing streak. Usually the problem is not in BB, but in the fact that:
- the entry was against the trend;
- there was no confirmation;
- the market was chaotic;
- expiry was chosen randomly.
If you trade short timeframes, this mistake looks very similar to what often happens in scalping on Binarium: visually, the signal is there, but the market context is too weak.
For testing, it is convenient to run setups on demo first, and if you trade via Binarium, it is better to use the TREND promo code only once the strategy has at least minimal statistical validation, not simply because it looked good.
Table: what to test
| What you test | Why | Common mistake |
|---|---|---|
| One timeframe | So the results remain comparable | Jumping between M1 / M5 / M15 in one day |
| One setup (for example, rebound in a flat market) | To understand whether the logic itself works | Mixing flat and trend trades into one dataset |
| One filter (level / candle / RSI) | To remove some false entries | Adding 4–5 indicators right away |
| Expiry in candles | To compare results across timeframes | Choosing the duration “by feel” |
How to read Bollinger Bands signals in binary options
Below are the core signals without which a Bollinger Bands strategy quickly turns into random guessing.
Touching the upper / lower band
This is not a ready entry button. In a flat market, a touch may hint at a rebound, while in a trend it may signal continuation. That is why it helps to confirm with price reaction, a level, or candlestick structure. Among chart patterns, it is also useful to study the head and shoulders pattern in trading to better spot moments when the market is truly breaking structure.
Price moving outside the band
A move outside the band can suggest:
- a strong impulse;
- a local spike;
- short-term overheating;
- a likely return to the channel.
Without confirmation, this signal is too weak for an entry.
Band contraction (squeeze)
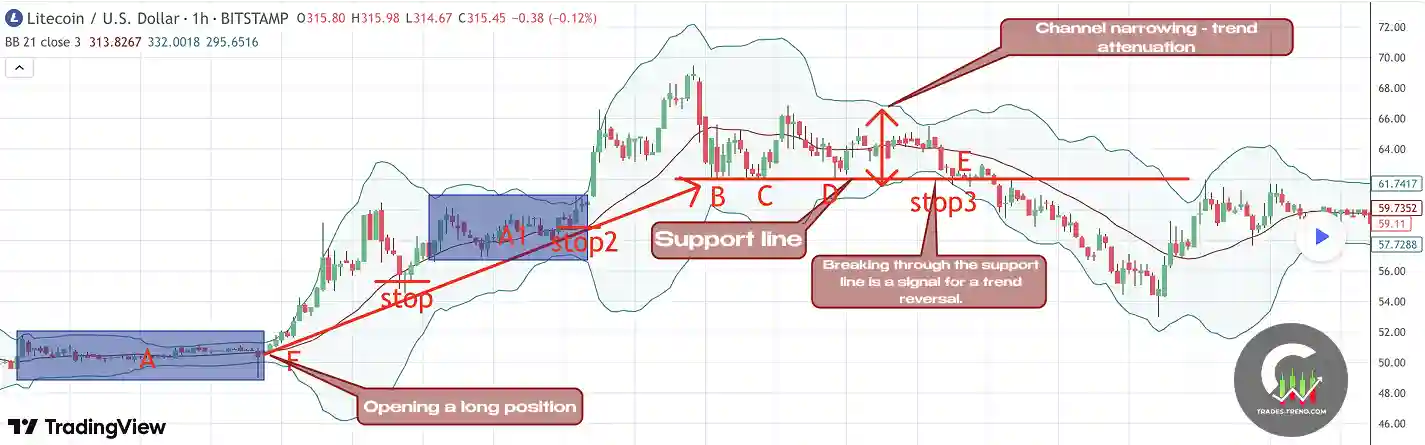
A squeeze shows reduced volatility: the market has compressed and may be preparing for a move. But the direction after contraction should be confirmed rather than guessed in advance.
Price riding the band
One of the most useful anti-mistake signals. If price is confidently moving along the band, the market may be strong, and attempts to catch a reversal just because of the touch often end in a series of poor entries.
Table: Bollinger Bands signal → what to do → when to skip
| BB signal | What it means | When to consider an entry | When to skip |
|---|---|---|---|
| Band touch | Price is at the edge of a range / impulse | There is a flat market and confirmation | Strong trend with no filter |
| Move outside the band | Spike / acceleration | There is logic for continuation or a return + confirmation | Emotion-driven entry with no context |
| Band contraction | The market compressed, volatility is low | After a confirmed breakout | If you are trying to guess direction in advance |
| Riding the band | Strong trend | Trading with the trend within a system | If you try to fade every touch |
Strategy #1: rebound in a flat market
This is one of the clearest setups to start with, but it only makes sense when the market is genuinely ranging and not merely looking that way at first glance.
When the strategy makes sense
- the market is flat;
- there is no strong impulse;
- price approaches one of the bands;
- there is confirmation through a candle, reaction, or level.
Entry logic
CALL — if price is near the lower band, the market is not falling impulsively, and there is confirmation of a rebound.
PUT — if price is near the upper band, the market is not rising impulsively, and there is confirmation of rejection.
When the signal is canceled
- the range starts expanding and the market is breaking out of the sideways zone;
- candles become sharp and erratic;
- you can no longer explain why this is a flat market rather than chaos.
Expiry
Expiry is better matched to the speed of the setup:
- a fast rebound inside the range is one logic;
- a slow return after a spike is another.
It is easier to test it in candles so you can compare results across different timeframes.
Strategy #2: breakout after band contraction (squeeze breakout)
This setup is useful for traders who want to work not only from range boundaries, but also with the start of an impulse move.
What to look for on the chart
- the bands contract noticeably;
- the market goes quiet;
- then movement appears and the bands start expanding.
The main beginner mistake
Entering before confirmation and trying to guess the breakout direction in advance.
What works better
Wait for confirmation through:
- the candle close;
- price reaction after the breakout;
- the nearest level;
- an additional filter — a candle, RSI, or market structure.
If you study impulse phases and acceleration zones separately, it is useful to read the material on imbalance (FVG) in trading: it complements post-squeeze logic very well.
When to skip
- there was a breakout, but price immediately returned into the range;
- the market is too choppy;
- there is no clear invalidation point for the setup.
Strategy #3: Bollinger Bands + filter (level / candle / RSI)
If you trade only by BB, you will get too many signals. That is why it is much more practical to use Bollinger Bands as the base and confirm the actual entry with an additional filter.
What you can use as a filter
- support / resistance levels;
- candlestick reaction or pattern;
- RSI as an extra filter, not as the main “judge.”
Why this is better than “naked” Bollinger Bands
Bollinger Bands show where attention appears, while the filter helps you understand whether there is real market logic behind the signal.
Table: Bollinger Bands + filter
| BB signal | Filter | What it confirms | What it filters out |
|---|---|---|---|
| Band touch | Level | A reaction in a clear zone | A random touch in the middle of a move |
| Contraction / breakout | Candle close + level | A real move out of the range | A false breakout with no follow-through |
| Spike and return | Candlestick reaction | Impulse weakening | An early entry without confirmation |
When it is better not to trade with Bollinger Bands
There are situations where BB shows many visual signals, but entry quality becomes much worse:
- a chaotic market with no structure;
- sharp news-driven spikes;
- a series of long candles with no pullbacks;
- a moment when you cannot explain the entry briefly and clearly;
- the state of “I just do not want to miss the move.”
If you feel pulled into chasing after an impulse, then the issue is no longer the indicator but FOMO in trading.
Step-by-step workflow: how to use Bollinger Bands without chaos
To keep a BB strategy from turning into a series of random clicks, follow a simple working process:
- Define the market phase: flat, trend, or chaos.
- Look at the BB signal: touch, contraction, expansion, or price riding the band.
- Check the level or zone, if there is one.
- Wait for confirmation: candle, reaction, or filter.
- Choose expiry by setup logic, not habit.
- Check the risk and clarity of the entry.
- If the signal is unclear — skip it.
Checklist before the trade
- I understand what kind of market this is right now: flat, trend, or chaos.
- There is a clear BB signal.
- There is confirmation.
- I am not entering blindly against a strong impulse.
- Expiry is chosen according to the setup logic.
- I can explain the entry in 1–2 sentences.
- If the signal is weak, I am ready to skip it.
Even a good BB setup will not save you without solid risk management and money management. And if after a losing streak you start forcing trades, then you need to review trading psychology and deposit protection.
Common beginner mistakes (and what to do instead)
Mistake 1: entering on a single band touch
What to do instead: first define the market phase, then wait for confirmation.
Mistake 2: trading against a strong trend
What to do instead: in a trend, look for trades in the direction of movement or wait for a genuinely strong reversal setup.
Mistake 3: entering before the candle closes
What to do instead: wait for the close. Until the candle is closed, its shape can change a lot.
Mistake 4: random expiry selection
What to do instead: test expiry in candles separately for each setup.
Mistake 5: constantly tweaking settings after every drawdown
What to do instead: change only one variable at a time and keep comparable statistics.
Mistake 6: no trade journal
What to do instead: record your entries and analyze where the logic breaks — in the market phase, the signal itself, the filter, or discipline.
Risk management and strategy testing with Bollinger Bands
Any strategy should be tested first and only then taken into “live battle” with real money.
What to check on demo
- separately by timeframe;
- separately by setup — rebound and squeeze;
- separately by asset;
- using identical entry rules.
If you test setups on a binary options platform, first go through the Broker and Binarium section and only then move to real trading. And even if you use the TREND promo code on your first deposit at Binarium, do not increase risk just because of the bonus: statistics and discipline still matter more.
Mini trade journal template
| Date / time | Asset | TF | Setup | Confirmation | Expiry | Result | Comment |
|---|---|---|---|---|---|---|---|
| — | — | — | Rebound / breakout | Level / candle / RSI | In candles | + / - | What worked / what broke |
FAQ: Bollinger Bands for binary options
Are Bollinger lines and Bollinger Bands the same thing?
Yes. It is the same indicator; both naming versions are used in trading content.
Are Bollinger Bands suitable for beginners in binary options?
Yes, if you treat them as a market-reading tool rather than a ready-made entry. For beginners, it is especially important not to trade off a single band touch.
Can you trade binary options using only Bollinger Bands?
You can, but signal quality is usually better if you add a filter: a level, a candlestick pattern, or RSI.
Is touching the upper band always a PUT signal?
No. In a strong trend, price can move along the upper band for several candles in a row. First define the market phase, then look for the setup.
What does Bollinger Band contraction mean?
It means lower volatility: the market is compressing and may be preparing for a move. But contraction itself does not say which direction the impulse will take.
How do you choose expiry in a BB strategy?
It is more logical to match expiry to the specific setup and timeframe. The same signal on different timeframes requires different time.
Which Bollinger Bands strategy is easiest to start with?
It is usually easier to start with rebounds in a flat market because the range boundaries are clearer there. Even then, the entry still needs a filter and confirmation.
Bottom line: how to start using BB for structure instead of chaos
In short, Bollinger Bands are useful in binary options when you use them to read the market rather than enter blindly:
- first define the market phase;
- then read the BB signal;
- then look for confirmation;
- and only after that make the trading decision.
Starter plan (7 days)
- Watch how BB behaves in flat markets and in trends.
- Choose one setup — for example, a rebound in a flat market.
- Add one filter: a level or a candlestick reaction.
- Test only on demo.
- Keep a trade journal.
- Review mistakes instead of changing everything at once.
- Move to real trades only after you have statistics.
Ready to apply this knowledge in practice?
Fund your Binarium account and use the promo code TREND to get a +100% bonus and test the strategy.